After surging by a total of 20% over the past 7 trading days and reaching a high of around $0.48, Ripple has recently rolled over and dropped by 3.28% over the past 24 hours bringing the current trading price down to $0.3883.
Before the price surge up toward the $0.48 level, Ripple had been trading within a sideways range for the entire period of 2019. The recent increase has allowed Ripple to break out of the previous stagnant price movement that it had been trading within.
Ripple remains ranked in 3rd position in the top cryptocurrencies as it presently holds a $16.42 billion market cap value.
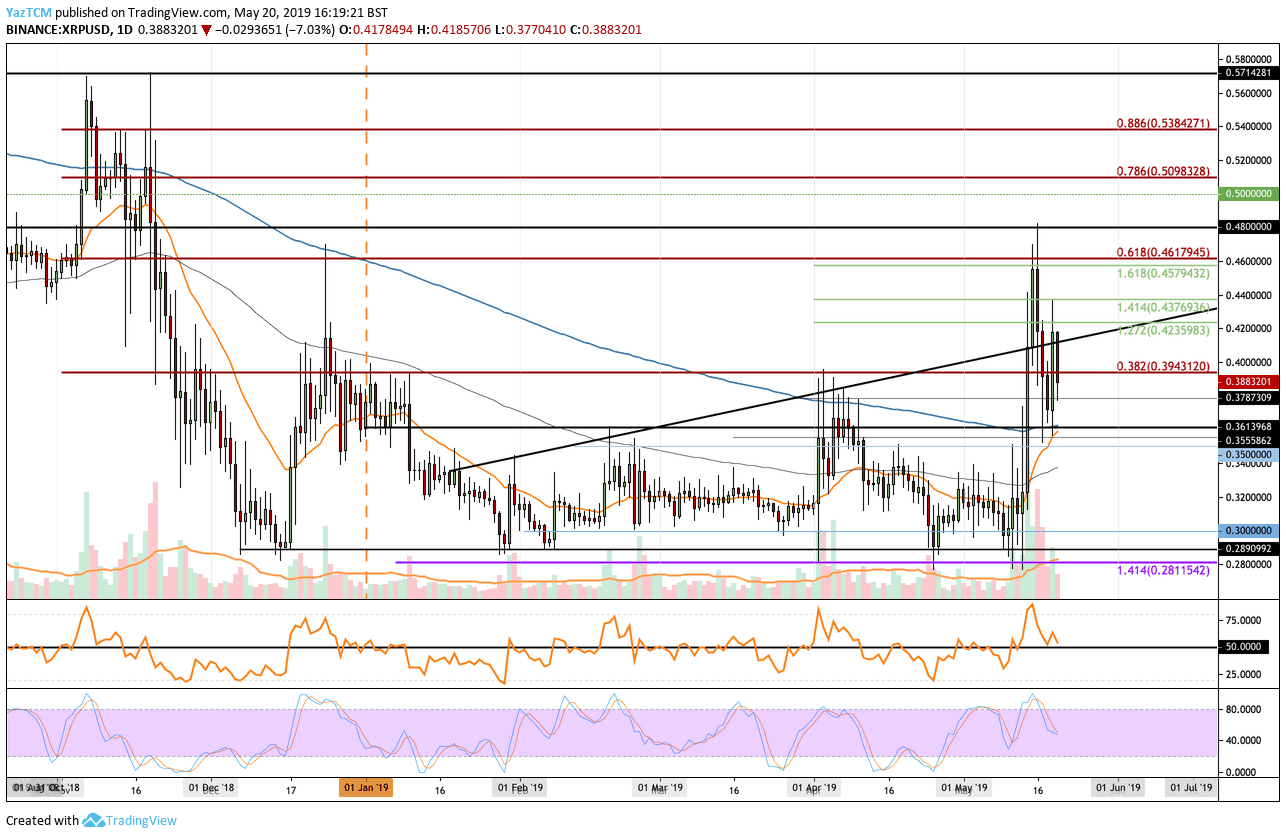
Looking at the XRP/USD 1-Day Chart:
- Since our previous XRP/USD analysis, we can see that XRP/USD continued to rise higher until reaching the highlighted resistance at the $0.4579 level which is provided by a short term 1.618 Fibonacci Extension level. XRP/USD then went on to fall but found support at around $0.36 and rebounded.
- From above: The nearest level of resistance now lies at $0.3943 and $0.40. Above $0.40, further resistance lies at $0.4235, $0.4376 and $0.4578. If the bulls can continue above $0.46, further resistance lies at $0.48, $0.50 and $0.5098.
- From below: The nearest level of support now lies at $0.3787 and $0.3613. Beneath this, further support lies at $0.3555 and $0.350. If the sellers continue beneath $0.35, we can expect more support at $0.33, $0.32 and $0.30.
- The trading volume has dropped since the surge witnessed a week ago. However, the trading volume still remains high.
- The RSI is presently trading along the 50 line which indicates indecision within the market. If it breaks beneath, we can expect the market to turn bearish and XRP/USD to head lower.
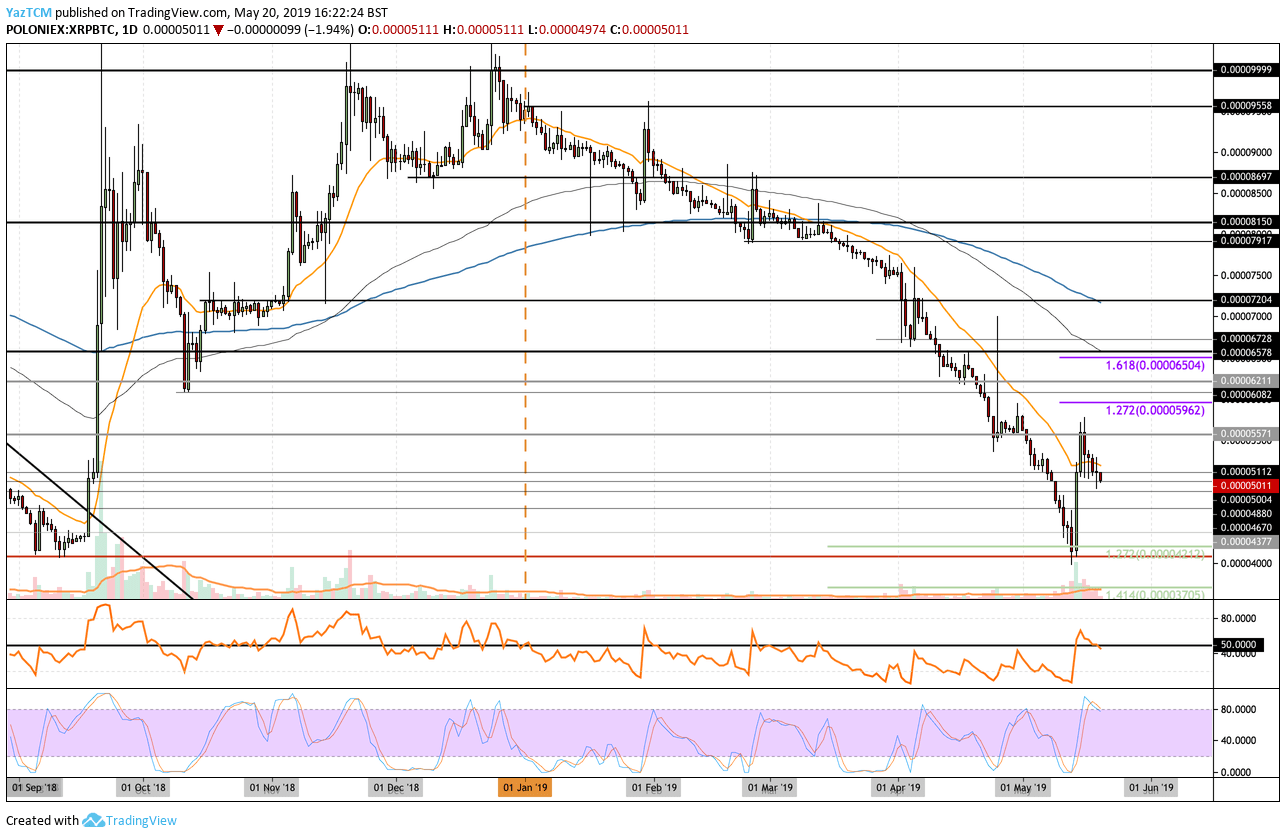
Looking at the XRP/BTC 1-Day Chart:
- Against Bitcoin, XRP/BTC had managed to find support around 4000 SAT and rebound higher into resistance around 5570 SAT. The coin has since fallen slightly and now trades at around 5011 SAT.
- From above: The nearest level of resistance lies at 5571 SAT and 6000 SAT. Above 6000 SAT, further resistance above lies at 6211 SAT, 6504 SAT, 6728 SAT and 7000 SAT.
- From below: The nearest level of strong support now lies at 5000 SAT. If the sellers break beneath 5000 SAT, further support lies at 488- SAT, 4670 SAT, 4377 SAT and 4000 SAT. If the selling continues beneath 4000 SAT, further support lies at 3,900 SAT, 3,800 SAT and 3705 SAT.
- The Stochastic RSI has recently produced a bearish crossover in overbought territory which signals that the market will be heading lower over the next few days.