The cryptocurrency market, on May 20, cooled down following strong rallies spurred by the king coin and the collective market cap stood at $247.5 billion. While Bitcoin [BTC] was struggling to surpass the $8,000 mark again, Litecoin [LTC] was over the $90-mark, despite slipping to the sixth position.
1-day BTC chart
The largest cryptocurrency by market cap, Bitcoin [BTC] was priced at $7,978 and recorded a minor rise of 0.55% over the past 24 hours. The digital coin held a market cap of $141.3 billion and registered a 24-hour trading volume of $24.04 billion.
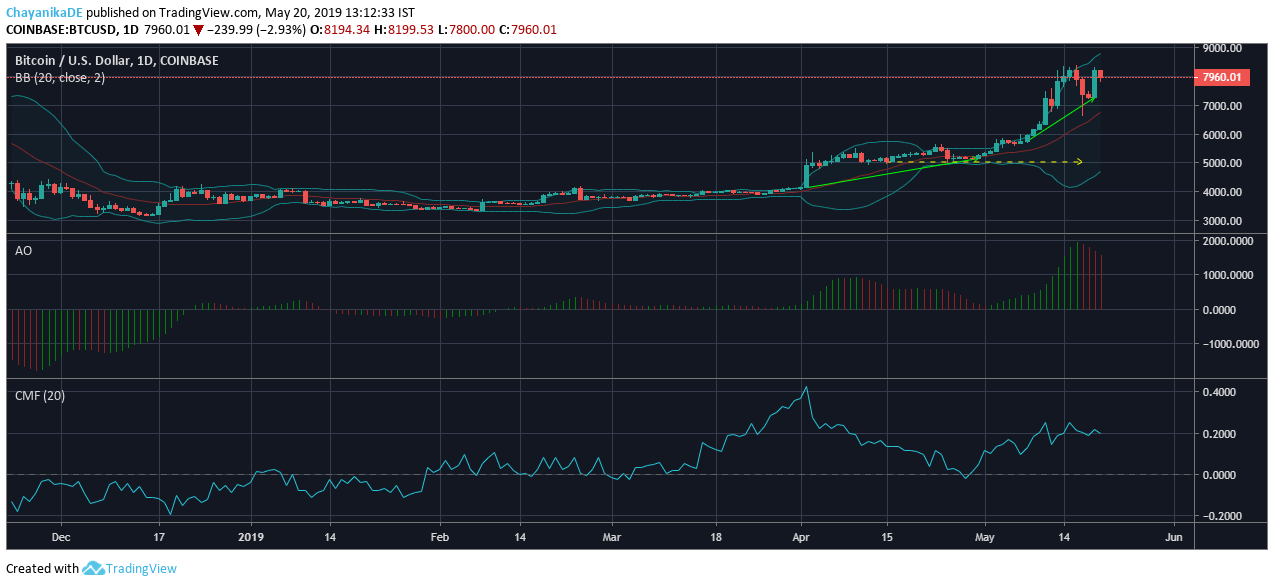
Source: TradingView
The one-day BTC chart registered two significant uptrends from $4,134 to $5,151, and another from $5,752 to $7,259, following the market pump. No significant downtrend was observed on the chart. Bitcoin found its support at $5,401.
Bollinger Bands: The diverging mouth of the bands indicated high volatility for the crypto-asset’s price.
Awesome Oscillator: The closing bars of the indicator were red, suggesting bearish momentum for Bitcoin.
Chaikin Money Flow: The CMF was above the zero-line, indicating that money was flowing into the coin market. Hence, a bullish price pattern for the Bitcoin was projected.
1-day LTC chart
The sixth largest crypto-asset on CoinMarketCap, Litecoin [LTC] held a market cap of $5.67 billion. LTC exhibited a decline of 1.37% over the past 24 hours and held a valuation of $91.75, at press time. Additionally, the coin recorded a trading volume of $3.98 billion over the past 24 hours.
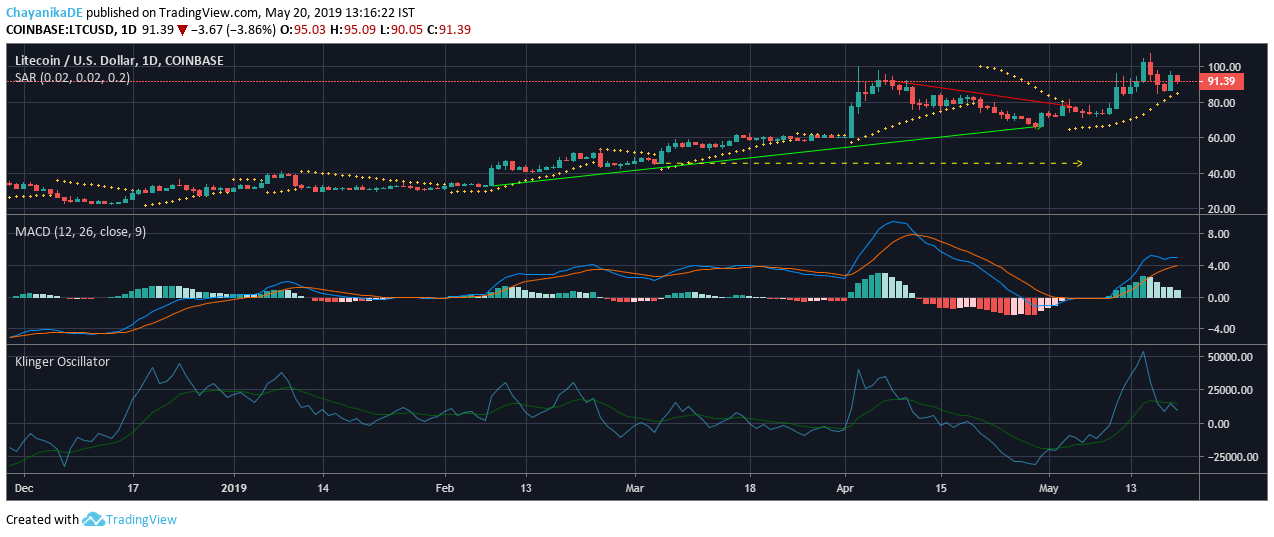
Source: TradingView
The one-day chart of Litecoin [LTC] recorded an uptrend from $32.86 to $66.76 and a downtrend from $91.95 to $77.75. Even as the coin was outperformed by EOS, the coin remained above the $90-mark. The immediate support for the coin stood at $45.81.
Parabolic SAR: The dotted markers were below the candlesticks, suggesting a bullish trend for the coin.
MACD: The MACD line was above the signal line, indicating that the coin was following a bullish course.
Klinger Oscillator: The reading line was below the signal line, projecting a bearish price pattern for the coin.
Conclusion
While some bearish activity was pictured in the markets of both Bitcoin and Litecoin, bulls seemed to have regained the upper hand.