- Ripple price corrected lower after a strong rally above $0.4500 and $0.4650 against the US dollar.
- The price tested the $0.3560 support area and it is currently moving higher with a positive tone.
- There is a crucial bullish trend line forming with support near $0.3855 on the 4-hours chart of the XRP/USD pair (data source from Bitstamp).
- The price is currently struggling near $0.4200, but it is likely to gain bullish momentum in the near term.
Ripple price rallied significantly towards $0.4800 against the US Dollar, and later corrected lower. XRP is currently holding the $0.3800 support and it is likely to climb higher.
Ripple Price Analysis
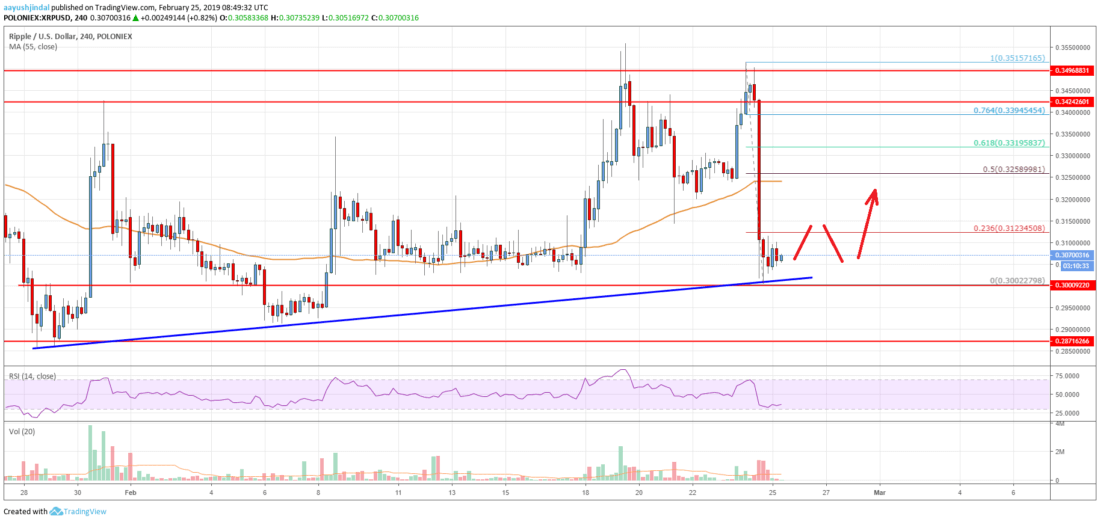
This past week, there was a significant rally in bitcoin, Ethereum, bitcoin cash, ADA and ripple against the US Dollar. The XRP/USD pair surged above the $0.3340, $0.3600 and $0.4000 resistance levels. There was a close above the $0.4200 level and the 55 simple moving average (4-hours). The upward move was such that the price even broke the $0.4500 and $0.4650 resistance levels. The price traded to a new 2019 high at $0.4800 and later started a major downside correction.
It traded below the $0.4500 and $0.4200 support levels to move into a short term bearish zone. However, the $0.3600 and $0.3640 support levels act as strong buy zones. A base was formed above $0.3600 and recently the price climbed above the $.3800 level. There was a break above the 23.6% Fib retracement level of the last decline from the $0.4800 high to $0.3564 swing low. The recent bounce was strong, taking the price above the $0.4150 level. The price even spiked above the 50% Fib retracement level of the last decline from the $0.4800 high to $0.3564 swing low.
However, the price seems to be struggling to settle above $0.4180 and $0.4200. On the downside, there is a crucial bullish trend line forming with support near $0.3855 on the 4-hours chart of the XRP/USD pair. As long as the price is above the trend line, it is likely to climb above the $0.4200 and $0.4500 resistance levels.
Looking at the chart, ripple price is showing positive signs above the $0.3850 and $0.3640 support levels. If there is a downside break below the $0.3640 support and $0.3600, the price is likely to move into a bearish zone. The next key support is at $0s.3340, where the bulls could protect additional losses.
Technical indicators
4 hours MACD – The MACD for XRP/USD is currently moving slowly into the bearish zone.
4 hours RSI (Relative Strength Index) – The RSI for XRP/USD is currently moving lower towards the 50 level.
Key Support Levels – $0.3850, $0.3640 and $0.3600.
Key Resistance Levels – $0.4180 and $0.4500.