- Avalanche price shows a bearish divergence between current highs and the highs established in September near $22.
- The Volume Profile Indicator shows the current uptrend as less powerful than the previous decline.
- This thesis remains neutral based on the factors mentioned below.
Avalanche is at a crossroads as the price hovers under a previous support zone. Key levels have been defined to gauge the next move.
Avalanche price at a make-or-break point
AVAX price has rallied 11% during the final week of October. The move north was catalyzed on October 25 as the bulls breached the 8-day exponential and 21-day simple moving averages. An influx of volume accompanies the recent ascension; however, it is not larger than the previous downtrend’s volume pattern.
Avalanche price currently auctions at $17. Multiple doji candles are displayed just below a previously broken support zone. The Relative Strength Index shows the AVAX price at the limits for when a corrective rally becomes an impulsive wave. There is a divergence between the current high and the highs in September at $22.
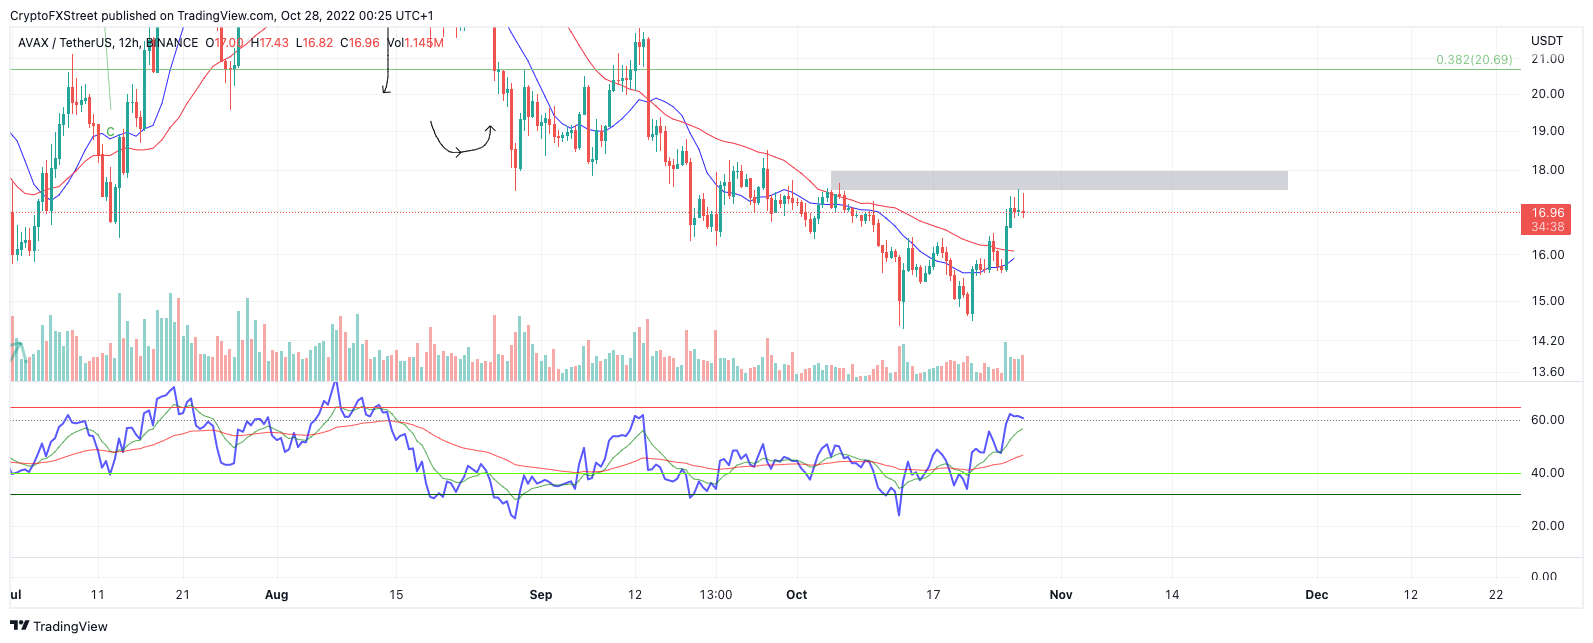
AVAX USDT 12-Hour Chart
Considering these factors, moving in now on the Avalanche price is a risky bet. AVAX will need to hurdle the $18 barrier if the market is genuinely bullish. In doing so, the bulls could continue rallying toward $20 for an additional hike.
On the contrary, failure to cross the newfound resistant level could lead to a liquidation event targeting the lows at $14.70. Such a move would result in a 15% decline from the current market value.
In the following video, our analysts deep dive into the price action of Bitcoin, analyzing key levels of interest in the market.