- Tron price formed a solid support base near the $0.0224 level against the US Dollar.
- TRX price gained traction recently and broke the $0.0255 and $0.0260 resistance levels.
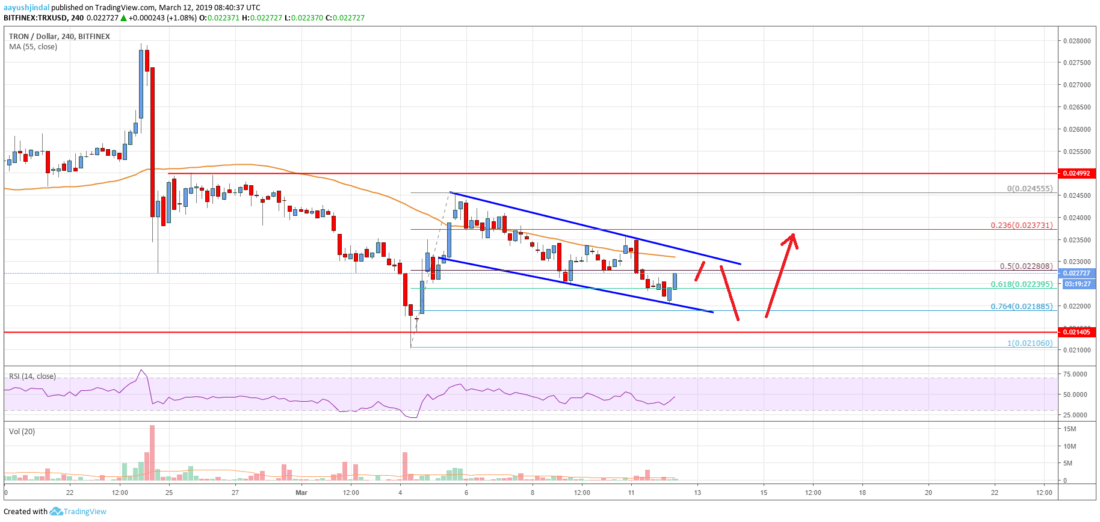
- There was a break above a major bearish trend line with resistance near $0.0254 on the 4-hours chart (data feed via Bitfinex).
- The price could start a significant upward move if it breaks the $0.0260 and $0.0271 resistances.
TRON price is showing positive signs against the US Dollar, while declining vs bitcoin. TRX could gain bullish momentum considering the current momentum in ETH, BTC and XRP.
Tron Price Analysis
This past week, there was a fresh decline in TRON price below $0.0240 against the US Dollar. The TRX/USD pair traded towards the $0.0224 level and later formed a strong support base. Finally, it started a decent upward move after bitcoin started a significant upward move. The bulls managed to push the price above the $0.0235 and $0.0240 resistance levels. There was even a close above $0.0240 and the 55 simple moving average (4-hours).
During the rise, there was a break above a major bearish trend line with resistance near $0.0254 on the 4-hours chart. The pair spiked above the $0.0260 level and traded as high as $0.0268. It is currently correcting lower below $0.0260, and the 23.6% Fibonacci retracement level of the last wave from the $0.0239 low to $0.0268 high. On the downside, there are many supports near the $0.0255 and $0.0250 levels. The 50% Fibonacci retracement level of the last wave from the $0.0239 low to $0.0268 high is also near $0.0254. Besides, the broken trend line is likely to act as a support near $0.0250.
On the upside, an initial resistance is near the $0.0265 level. A clear break above the recent high is likely to open the doors for more gains above the $0.0270 and $0.0280 levels. The main target for the bulls this week could be $0.0300 and $0.0305. On the downside, only a close below $0.0240 and 55 simple moving average (4-hours) might negate the current bullish view.
The chart indicates that TRX price clearly broke a few important resistances near $0.0250. Having said that, the price must gain momentum above $0.0265 to continue higher. If not, there is a risk of a fresh decline below the $0.0250 and $0.0240 support levels in the near term.
Technical Indicators
4 hours MACD – The MACD for TRX/USD is slowly gaining pace in the bullish zone.
4 hours RSI – The RSI for TRX/USD is currently correcting lower towards the 50 level, but it is likely to bounce back.
Key Support Levels – $0.0250 and $0.0240.
Key Resistance Levels – $0.0265, $0.0270 and $0.0280.