- Dogecoin price pattern attracts ‘Burj Khalifa’ pattern due to continuous selling since May 2021.
- As the price continues to decline, experts are looking bearish on Dogecoin price predictions.
- Meme-coin DOGE price has been stuck in a range bound range for the last 10 trading sessions.
The world famous Namecoin – DOGE has reached the trading zone of 18 months. Although this trading zone was the lowest zone for Dogecoin price in 2022, some investors and experts are still bearish on it, on the contrary, some big analyst said that Dogecoin price has turned lower and the price is at this level. can bounce back.
Dogecoin Price Prediction on weekly chart
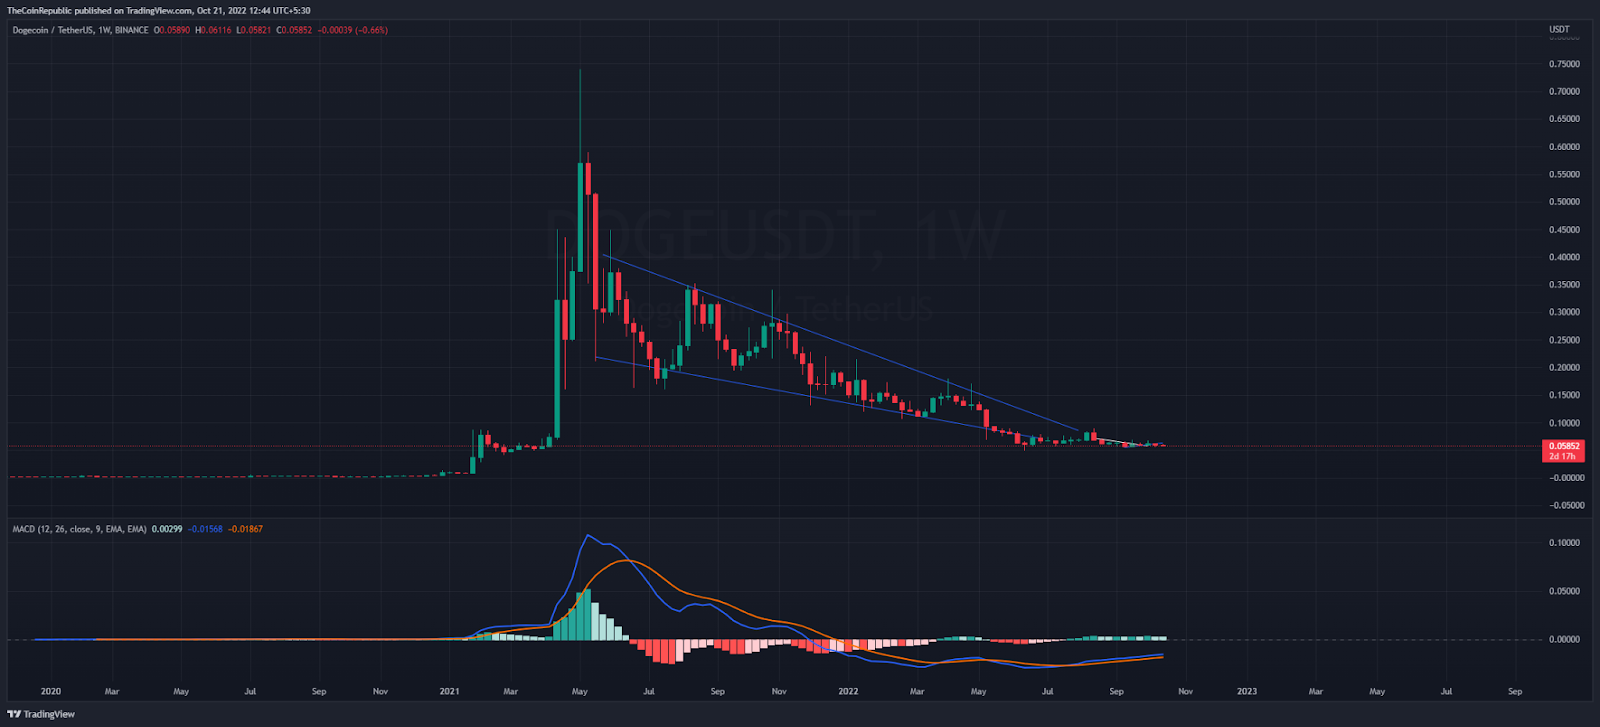
The weekly price pattern of DOGE Crypto shows exactly the same structure as ‘Burj Khalifa’. Rapid pump and dump noted a high of $0.73995, subsequently, the price has been declining frequently. In the midst of a lower-higher trend, Dogecoin price broke a descending wedge pattern before moving into a sideways trend. Notably, after the crossover, the MACD indicator spreads higher towards the neutral zone, but still, the market is not moving higher.
So far, Dogecoin price seems to be trending sideways. Meanwhile, Dogecoin price against the USDT pair remains inside yesterday’s trading range, while the price is trading at the $0.0586 mark at press time. Buyers are facing price drop today. Furthermore, the DOGE value is down 1.27% at 0.000003082 satoshis with respect to the bitcoin pair.
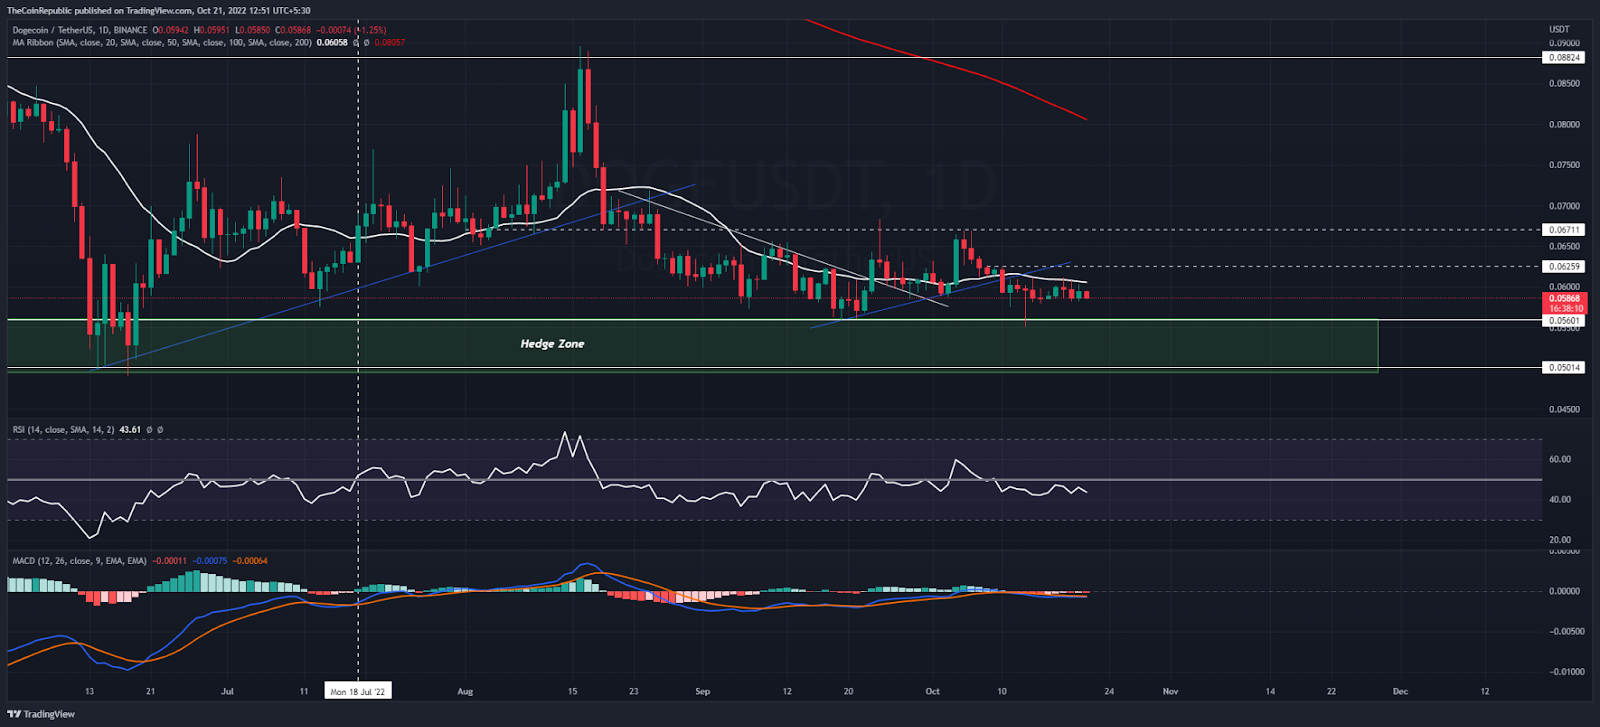
Undoubtedly, the market sentiment has been weak for the past several days. Thus the 20-day moving average is the biggest reason behind the sideways trend in DOGE crypto. Buyers continue to decline to convert this level into an immediate support level.
The RSI indicator remains at 44 points at the time, it remains below the halfway mark for over 10 days. The RSI is suggesting a sideways zone. Moreover, the MACD is trending lower in the negative zone in terms of the daily price scale. For the short term outlook, both the indicators show downside for Dogecoin price prediction.
Conclusion
Dogecoin price remains in a tight trading range while it is consistently receiving higher price rejections at the 20-day moving average. Dogecoin price predictions suggest a further more sideways trend until buyers flip the 20 DMA to an immediate support level.
Resistance level- $0.065 and $0.090
Support level- $0.055 and $0.050
Disclaimer
The views and opinions stated by the author, or any people named in this article, are for informational ideas only, and they do not establish the financial, investment, or other advice. Investing in or trading crypto assets comes with a risk of financial loss.