- Tron price failed to recover and declined below the $0.0240 support area against the US Dollar.
- TRX tested the $0.0225 support level and it is currently consolidating above $0.0230.
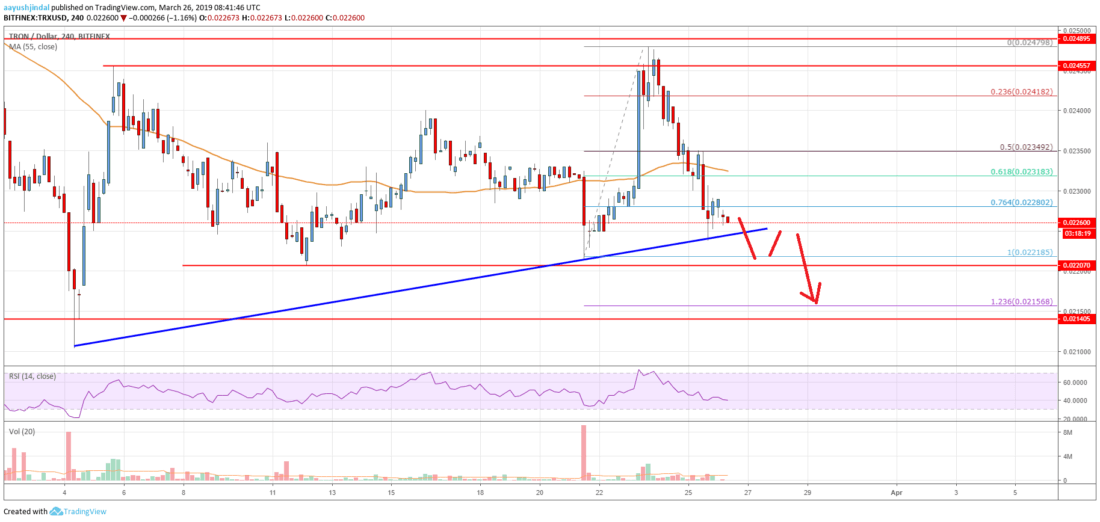
- There is a significant bearish trend line in place with resistance at $0.0240 on the 4-hours chart (data feed via Bitfinex).
- The price could start a sharp upward move if there is a break above $0.0240 and $0.0250.
TRON price extended losses below key supports against the US Dollar and bitcoin. TRX is currently consolidating and it is likely to make the next move either above $0.0250 or towards $0.0200.
Tron Price Analysis
This past week, TRON price faced an increase in selling pressure below $0.0255 against the US Dollar. The TRX/USD pair broke the key $0.0250 support level to move further into a bearish zone. There was a sharp decline below the $0.0240 and $0.0235 support levels. The price even broke the $0.0230 level and settled well below the 55 simple moving average (4-hours). A new monthly low was formed near $0.0224 and the price is currently consolidating losses.
Recently, it traded above the 50% Fibonacci retracement level of the last drop from the $0.0255 high to $0.0224 low. However, the previous support near $0.0244 and $0.0245 acted as a strong resistance. The 61.8% Fibonacci retracement level of the last drop from the $0.0255 high to $0.0224 low also prevented gains. More importantly, there is a significant bearish trend line in place with resistance at $0.0240 on the 4-hours chart. Therefore, if there is an upside break above the $0.0240 resistance and the 55 SMA, there could be a decent upward move.
Having said that, a convincing follow through above $0.0245 and $0.0250 is needed for a trend change in the near term. The next key resistance above $0.0250 is near the $0.0257, above which the price could test $0.0280. On the other, there might be a bearish reaction if there is no upside break above $0.0240. An immediate support is near $0.0225 and $0.0224.
The chart indicates that TRX price is facing a strong resistance near the $0.0240 and $0.0245 levels. If there is a successful daily close above $0.00245 and $0.0250, there might be a strong upward move. If not, there is a risk of a fresh decline below $0.0224. In the mentioned bearish case, the price may perhaps test the $0.0200 support level.
Technical Indicators
4 hours MACD – The MACD for TRX/USD is currently flat in the bearish zone, with a few positive signs.
4 hours RSI – The RSI for TRX/USD is showing recovery signs, but it is still below the 50 level.
Key Support Levels – $0.0225 and $0.0210.
Key Resistance Levels – $0.0240, $0.0245 and $0.0250.