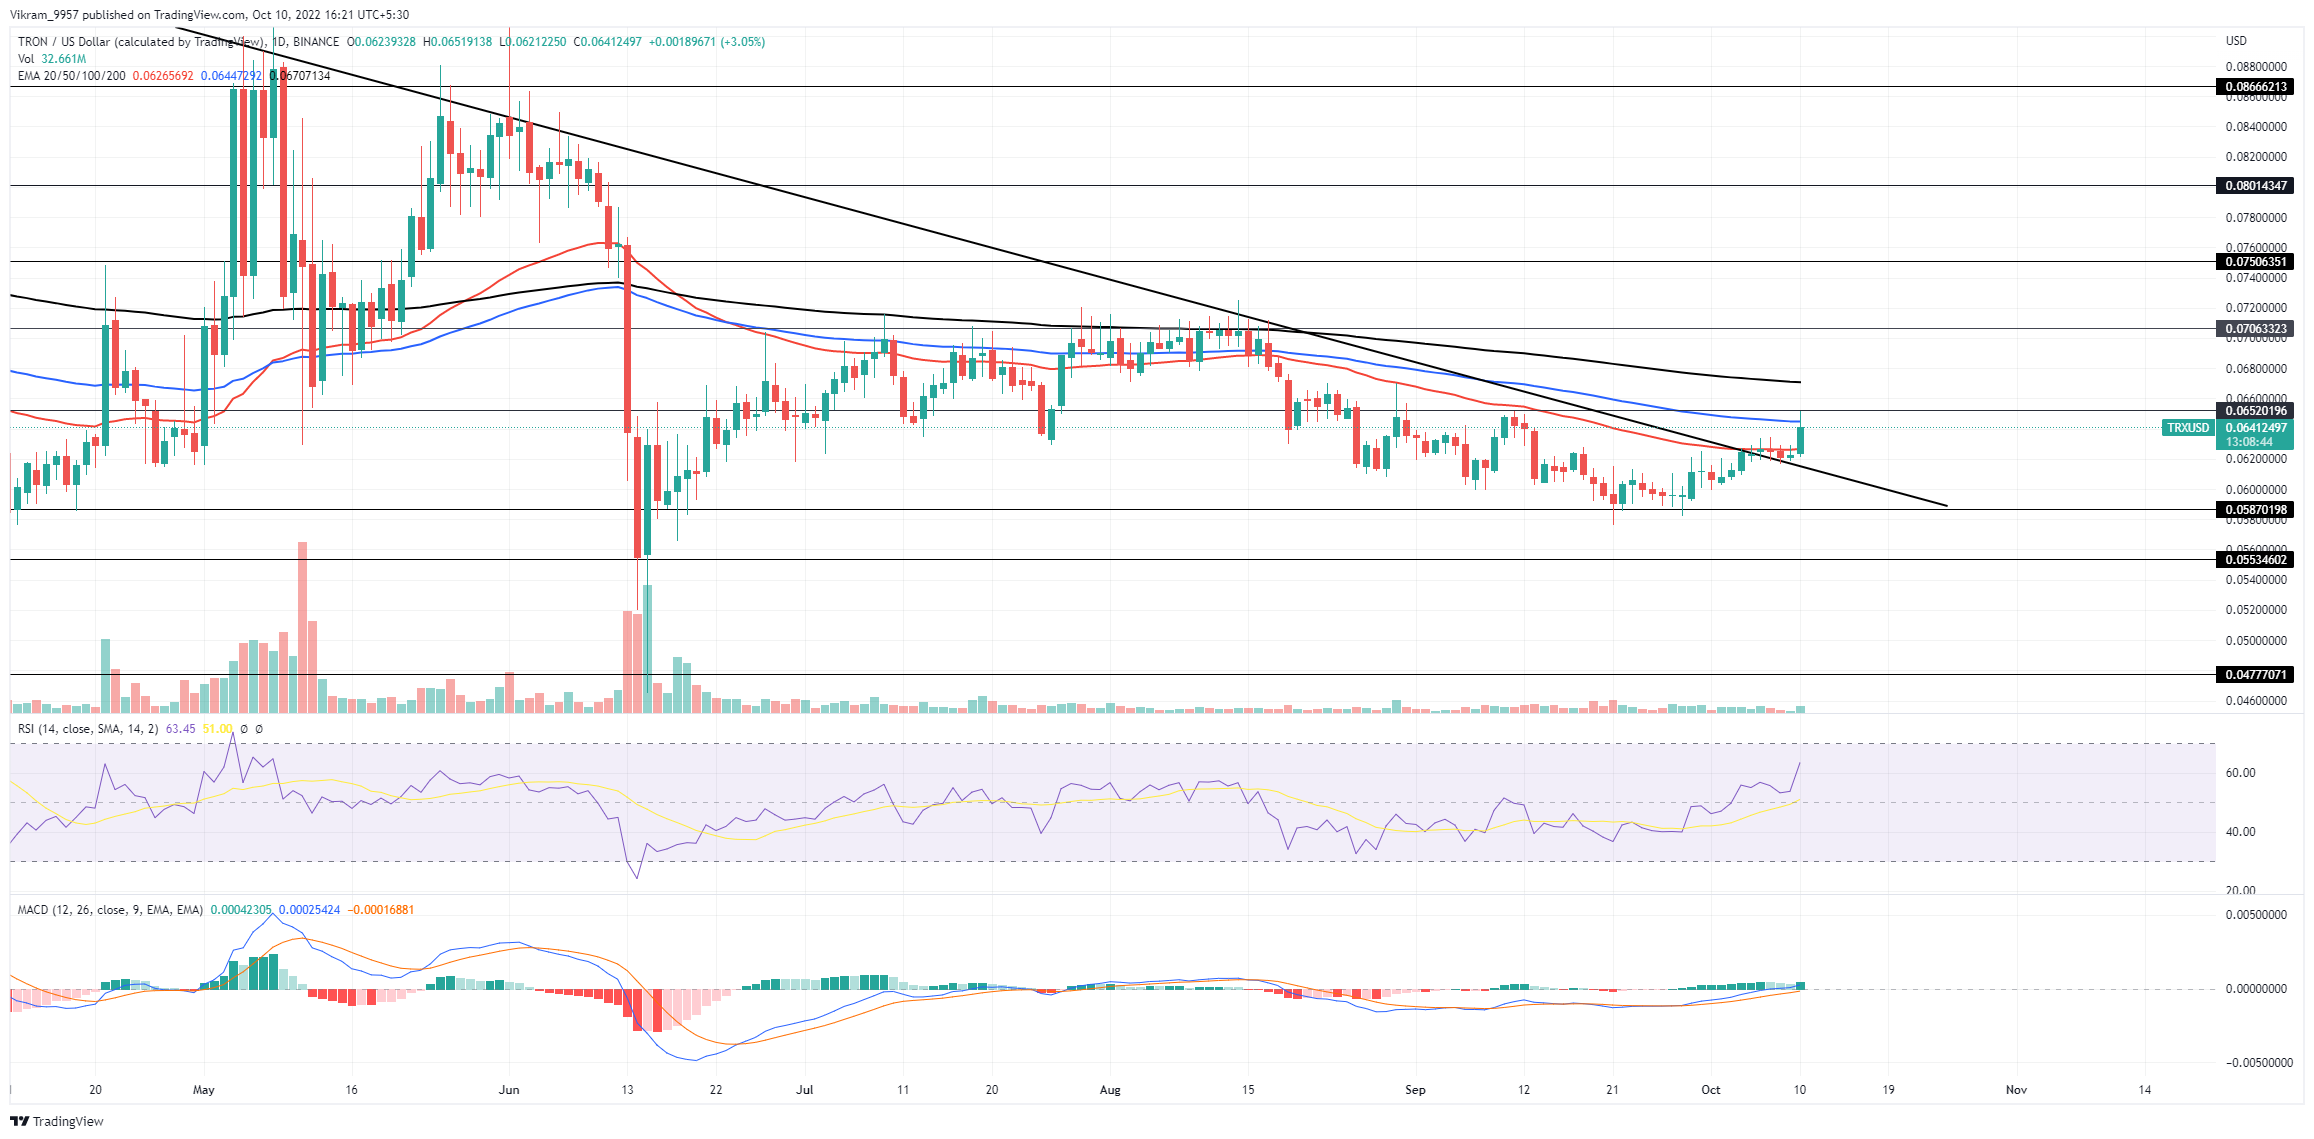
The TRX Technical Analysis shows a bullish breakout of a long-coming resistance trendline unleashing the trapped momentum and challenging sellers at $0.065. The TRX price action showed a bullish breakout of a bearish trendline, with a 3% jump today, resulting in a bullish candle. However, the increase in selling pressure at $0.065 causes a higher price rejection to keep the bullish growth in check. So, will Tron prices break above the $0.065 mark?
Key Points:
- The Tron price action shows a bullish breakout entry opportunity.
- The price jump challenges the 100-day EMA.
- The intraday trading volume in Tron is $499 million.
 Source - TradingView
TRX Technical Analysis
The TRX price action shows a bullish recovery rally from $0.058 after a long-term downtrend under the influence of a resistance trendline. The bull run accounts for a price jump of 10% in the last two weeks. However, the price breakout rally struggles to exceed the overhead resistance level of $0.065, leading to a higher rejection in the daily candle. Moreover, the 100-day EMA breakout rally reverses and approaches the 50-day EMA. Therefore, questions about the bullish trend sustaining in the daily chart are rising, while some expect it as a retest of the broken trendline. If the selling pressure grows over the day, the Tron market price will drop below the broken trendline and the 50-day EMA at $0.0619. In such a case, sideline traders can take a bearish position with a target of $0.058. Optimistically, if the bullish momentum sustains, a post-retest reversal will sustain the TRX prices above the $0.062 mark. In such a case, the traders can expect the recovery rally to break the $0.065 resistance level to reach the 200-day EMA at $0.068.
Technical Indicators
The RSI indicator shows a spike in the nearly overbought zone, reflecting a sharp increase in the underlying bullishness. Moreover, the bullish trend in the MACD and signal lines display an increase in buying pressure. Therefore, the TRX technical analysis suggests that traders can find a buying opportunity if the daily candle closes above the 50 or 100-day EMA. Resistance Levels - $0.065 and $0.070 Support Levels - $0.62 and $0.58
 cryptoknowmics.com