- Stellar lumen price extended losses and broke the key $0.1100 support area against the US Dollar.
- XLM price even broke the $0.1050 and $0.1000 support levels to enter a downtrend.
- There is a major bearish trend line forming with resistance at $0.1045 on the 4-hours chart (data feed via Kraken).
- The pair is likely to struggle as long as it is below the $0.1050 and $0.1100 resistance levels.
Stellar lumen price is facing an increase in selling pressure against the US Dollar, bitcoin and Ethereum. XLM price could slide below $0.0900 if it stays below $0.1050.
Stellar Lumen Price Analysis (XLM to USD)
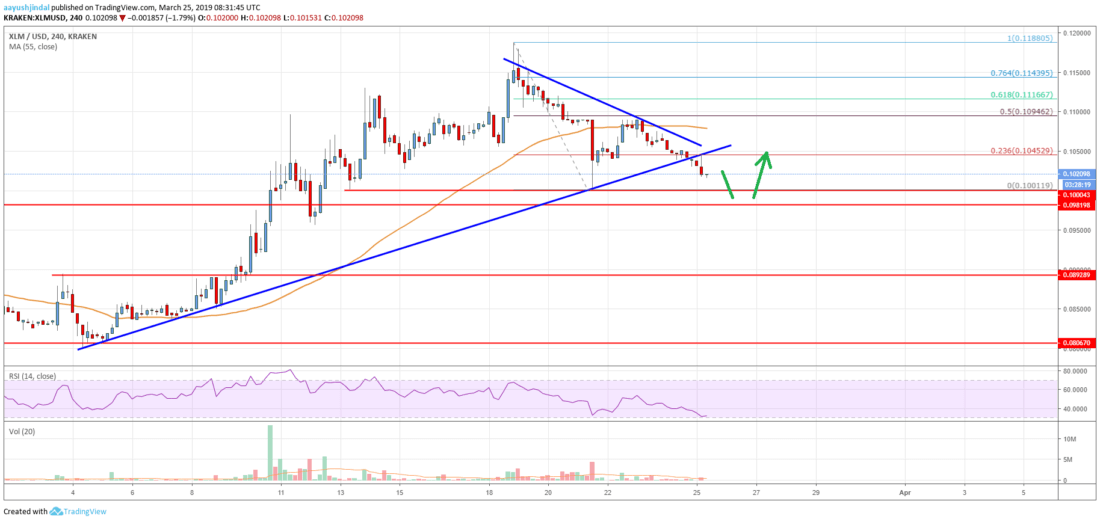
This past week, stellar lumen price started a strong decline below the $0.1100 support against the US Dollar. The XLM/USD pair gained bearish momentum and broke the $0.1050 and $0.1000 support levels. The price even broke the $0.0950 support and settled well below the 55 simple moving average (4-hours). A new swing low was formed at $0.0928 and recently corrected higher. It broke the $0.0980 level and the 23.6% Fibonacci retracement level of the last decline from the $0.1152 high to $0.0928 low.
However, the price is struggling to regain the $0.1000 level. On the upside, there is a strong resistance formed near $0.1040 and the 55 simple moving average (4-hours). Besides, the 50% Fibonacci retracement level of the last decline from the $0.1152 high to $0.0928 low is also near the $0.1040 level. More importantly, there is a major bearish trend line forming with resistance at $0.1045 on the 4-hours chart. If there is a successful close above $0.1050 and the 55 simple moving average (4-hours), the price could correct further higher.
The next key resistance is near the $0.1100 level (the previous support area). If the price fails to climb above $0.1050, there could be a fresh decline in the near term. An initial support is near $0.0920, below which the price could test the $0.0900 level. If the bears remain in action for a long time, the price could even test the $0.0820 level.
The chart indicates that XLM price is clearly trading in a downtrend below the $0.1050 level. As long as the price is trading below $0.1050 and the 55 SMA, there are chances of more losses. To start a strong upward move, the bulls need to clear $0.1050 and gain momentum above the $0.1100 resistance level.
Technical Indicators
4 hours MACD – The MACD for XLM/USD is still placed heavily in the bearish zone.
4 hours RSI – The RSI for XLM/USD is currently well below the 45 and 40 levels, with a bearish angle.
Key Support Levels – $0.0920 and $0.0900.
Key Resistance Levels – $0.1040, $0.1050 and $0.1100.