Tellor and Band Protocol prices are in a bullish breakout pattern. BAND/USDT could expand to $11 while TRB/USDT buyers target $90.
Tellor (TRB)
The oracle provider in Ethereum uses a proof-of-stake and work consensus algorithm for security and data validation. TRB is the platform's internal token.
Past Performance of TRB
The token is printing higher, presently retesting July 2021 highs.
While TRB remains bullish, the failure to firmly close above $50 puts buyers in a precarious position.
A comprehensive breakout above July 2021 highs will confirm the double-bar bullish reversal pattern of July 20 ad 21.
Day-Ahead and What to Expect
Even though the uptrend is clear, TRB/USDT prices are in range.
Even so, this is not to dismiss the fact that TRB is bottoming up, trading within a bullish breakout pattern above the middle BB.
Nonetheless, a follow-through of last week could see TRB soar to $90.
TRB/USDT Technical Analysis
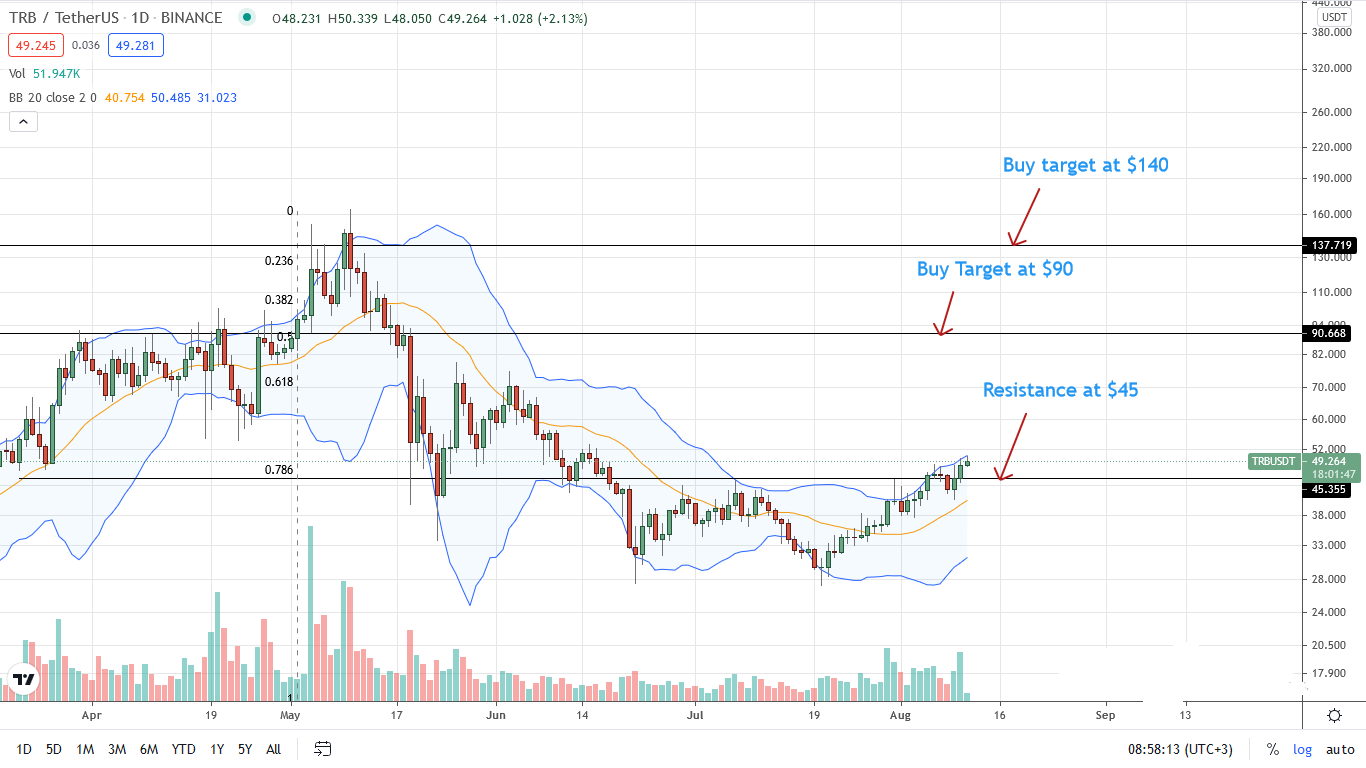
The short-term trajectory of TRB is whether buyers will overcome the double-tops of July and early August 2021.
Aforementioned, there is confidence.
However, this needs to translate to a high-volume break above $50 in confirmation of late July gains.
In this case, TRB prices may expand to $90 in a rebound from H1 2021 pits.
Band Protocol (BAND)
The Oracle provider in Ethereum is the second most adopted after Chainlink. BAND is the protocol's internal currency.
Past Performance of BAND
At press time, BAND prices are throbbing above July 2021 highs, adding 11 percent against the greenback on the last trading day.
Notably, BAND/USDT prices are bottoming up after bears of Q2 2021 wiped out gains of Q1.
Day-Ahead and What to Expect
After a brief period of consolidation, BAND prices rocketed away from the July 2021 high, confirming the bullish breakout registered over the weekend.
At this pace, BAND may retest $11 in the short term as momentum builds following steep losses of May through June.
BAND/USDT Technical Analysis
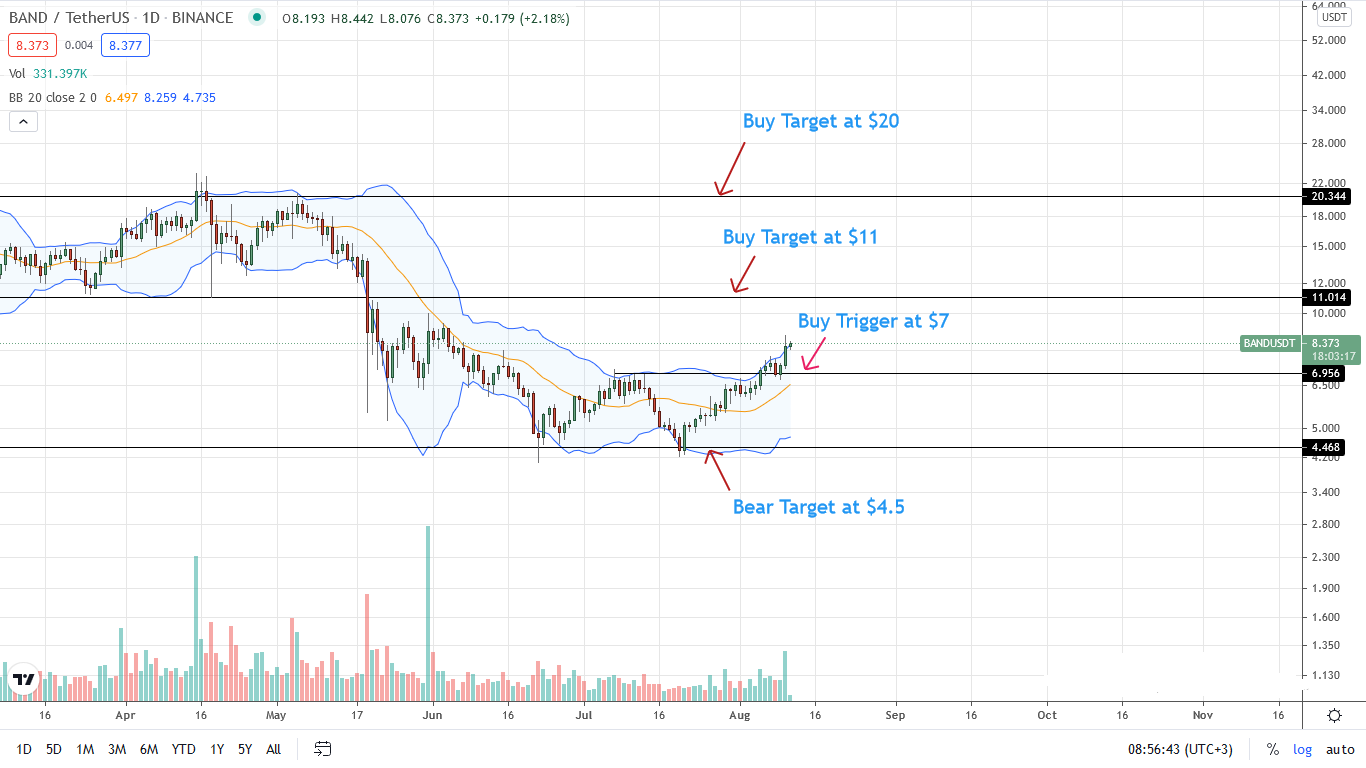
BAND bulls are in control.
Considering the candlestick arrangement in the daily chart, every low may offer a loading opportunity for aggressive bulls.
It is after the rebound from $7 and July high, completing the bullish breakout pattern.
As it is, aggressive traders may target $11.
However, the pace of the uptrend depends on the level of participation. This, in turn, will directly buoy buyers, rejecting attempts of lower lows below $7.