Ethereum (ETH) has moved above the $2,850 resistance area but is facing resistance at $3,360.
XRP (XRP) is approaching resistance at $1.05.
Zcash (ZEC) and Curve DAO Token (CRV) have broken out from descending resistance lines.
1Inch (1INCH) has reclaimed the $2.20 horizontal support area after initially deviating below it.
Small Love Potion (SLP) is following a descending resistance line.
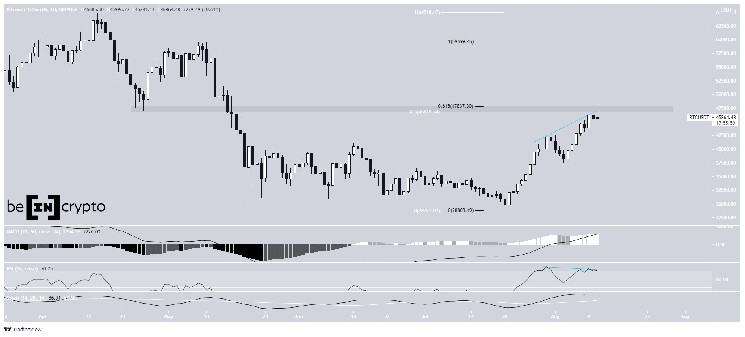
BTC
BTC has been increasing since reaching a local low on July 20. It created a higher low on Aug 5, and began to accelerate.
However, it’s approaching a significant resistance azone between $46,800 and $47,800. The area is created by the long-term 0.5 Fib retracement level (white), the short-term 0.618 Fib retracement resistance level (black), and a horizontal resistance area.
While the Stochastic oscillator and MACD are bullish, the RSI has begun to generate a bearish divergence.
Therefore, BTC could retrace after potentially reaching a top inside this area.
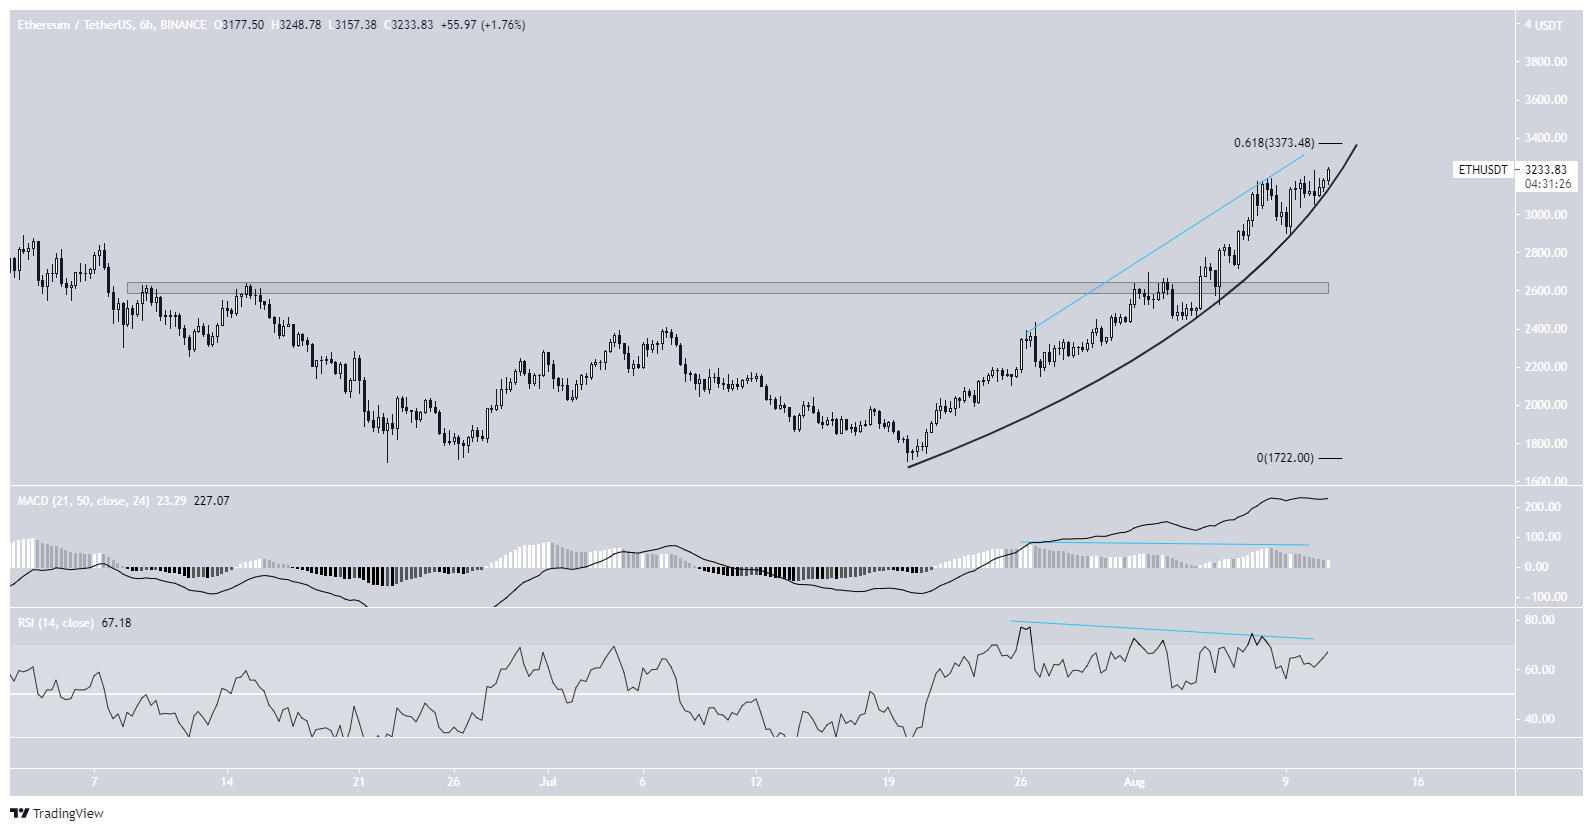
ETH
ETH has been increasing rapidly since creating a higher low on July 20.
The move further accelerated on Aug 5 after it reclaimed the $2,600 horizontal support area.
ETH is approaching the $0.618 Fib retracement resistance level at $3,370. In addition to this, both the MACD and RSI have generated bearish divergences. Therefore, it’s possible that some type of rejection will transpire after ETH reaches this level.
In addition, the upward move is becoming parabolic.
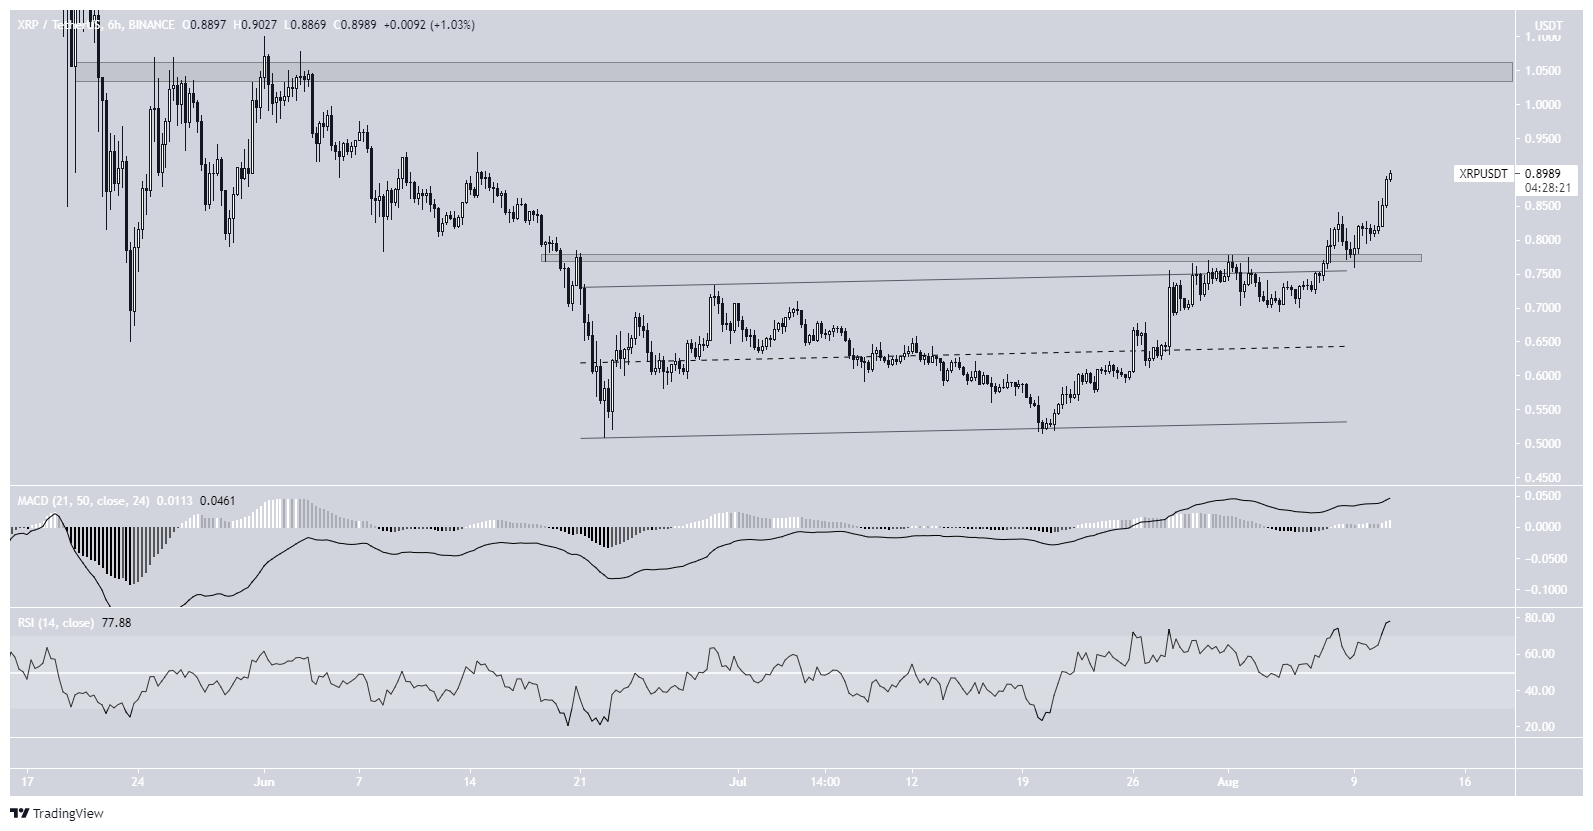
XRP
On Aug 6, XRP broke out from an ascending parallel channel that had been in place since May 22. Shortly after, it reclaimed the $0.77 horizontal resistance area.
So far, XRP has managed to reach a local high of $0.90 on Aug 11.
The main resistance area is found at $1.05. Technical indicators do not yet show any signs of weakness.
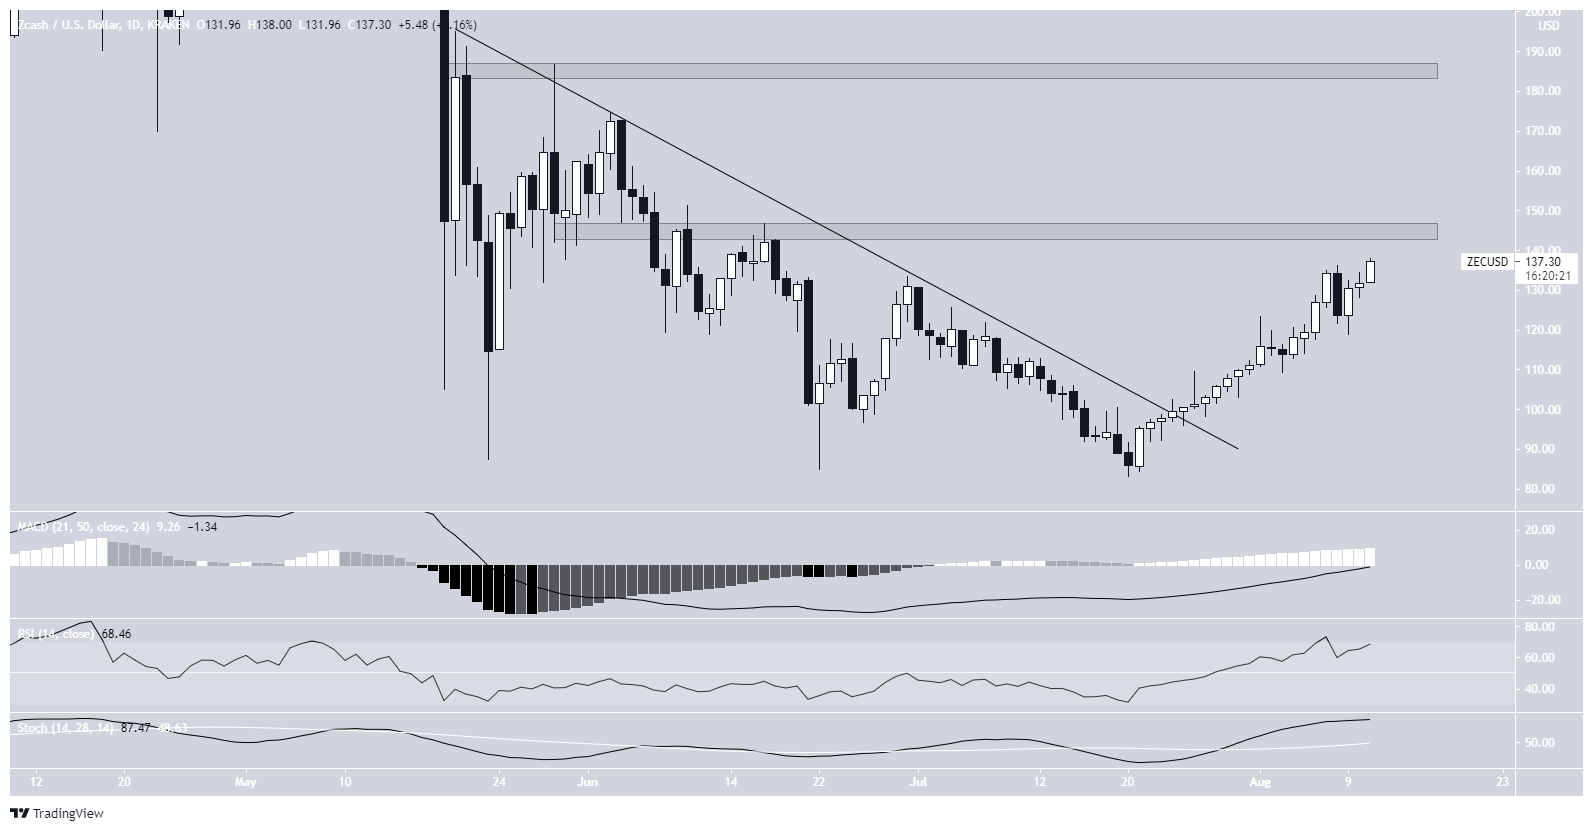
ZEC
ZEC has been increasing since breaking out from a descending resistance line on July 25. Technical indicators in the daily timeframe are bullish. The MACD is nearly positive and both the RSI and Stochastic oscillator are increasing.
The main resistance area is found at $145. A breakout above this level would likely take ZEC toward $185.
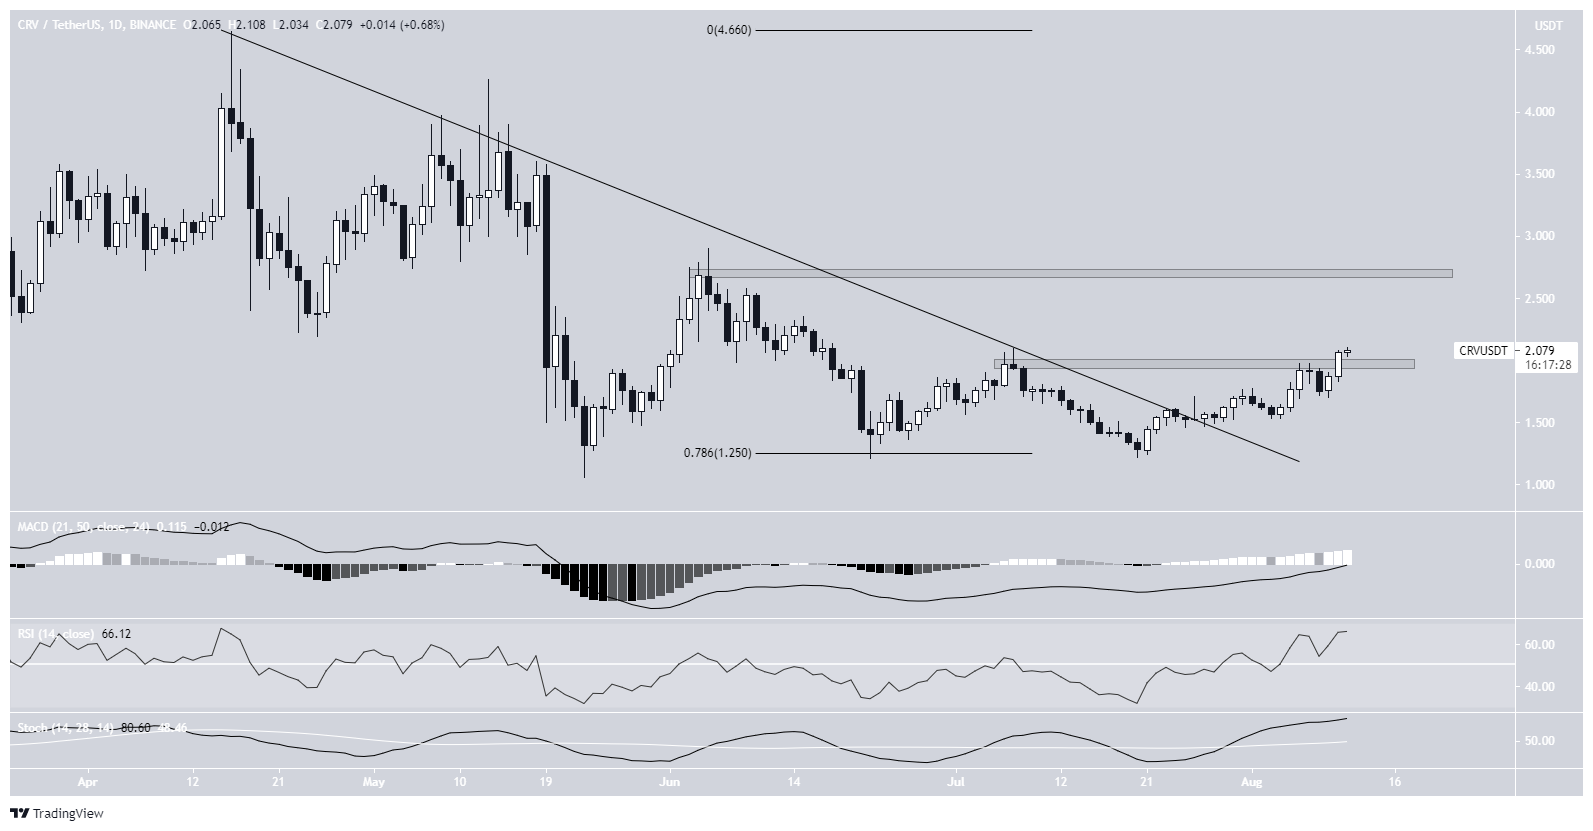
CRV
CRV has been increasing since bouncing at the 0.786 horizontal support level of $1.25 on July 20. On July 27, it broke out from a descending resistance line and accelerated.
Similar to ZEC, technical indicators in the daily time frame are bullish.
CRV is in the process of breaking out from the $2 horizontal resistance area. Doing so would likely take it toward $2.70.
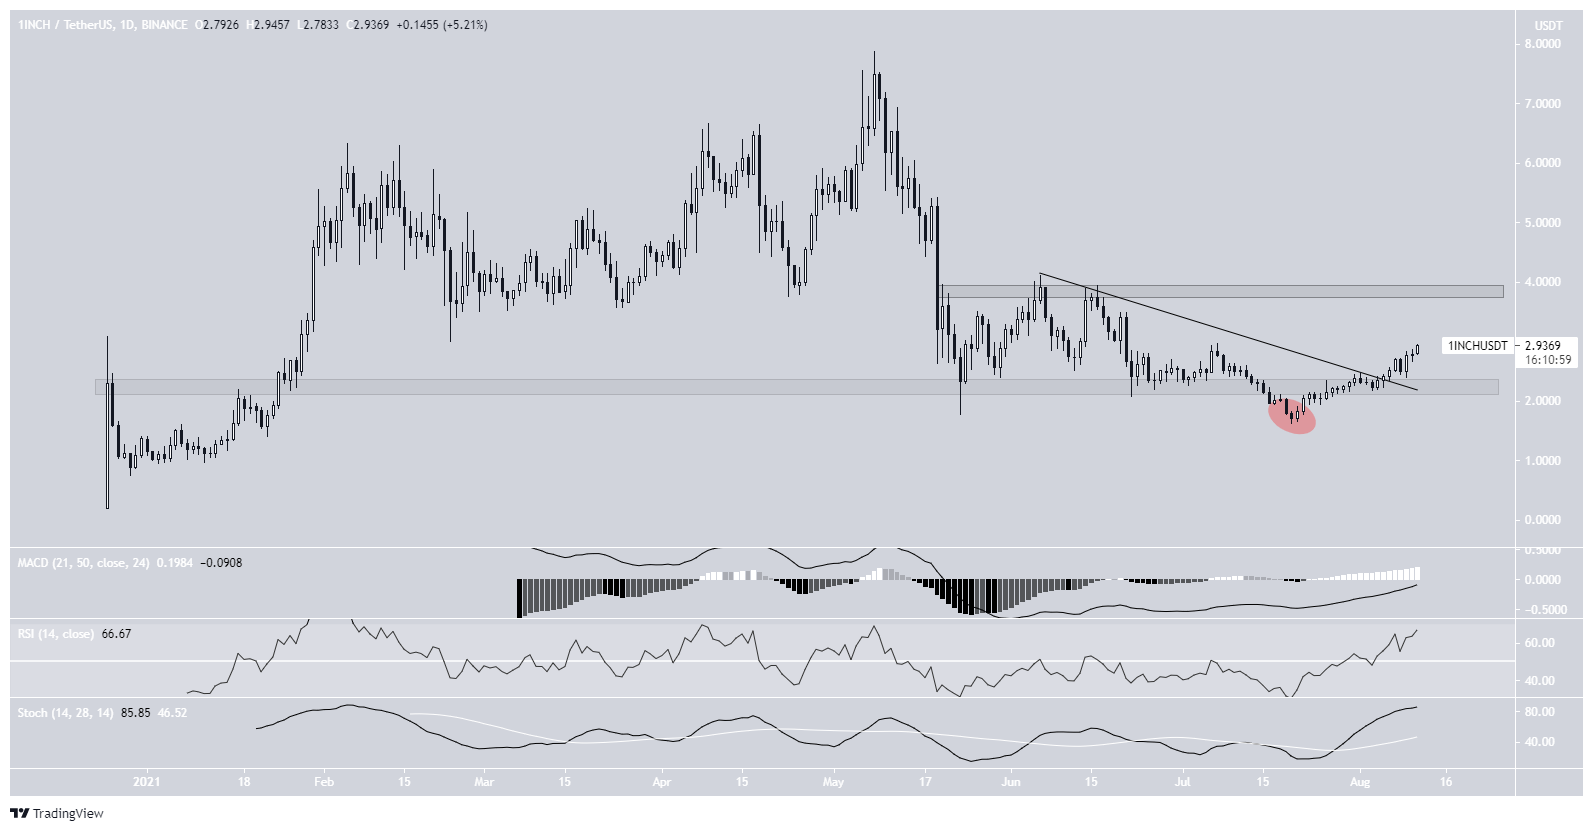
1INCH
On July 17, 1INCH appeared to have broken down below the $2.20 horizontal support are (red circle). However, it reclaimed the level shortly after and has been moving upwards since.
So far, it has broken out from a descending resistance line and managed to reach a high of $2.94 on Aug 11.
The main resistance area is found at $3.85. 1INCH has not traded above this level since the May 19 crash.
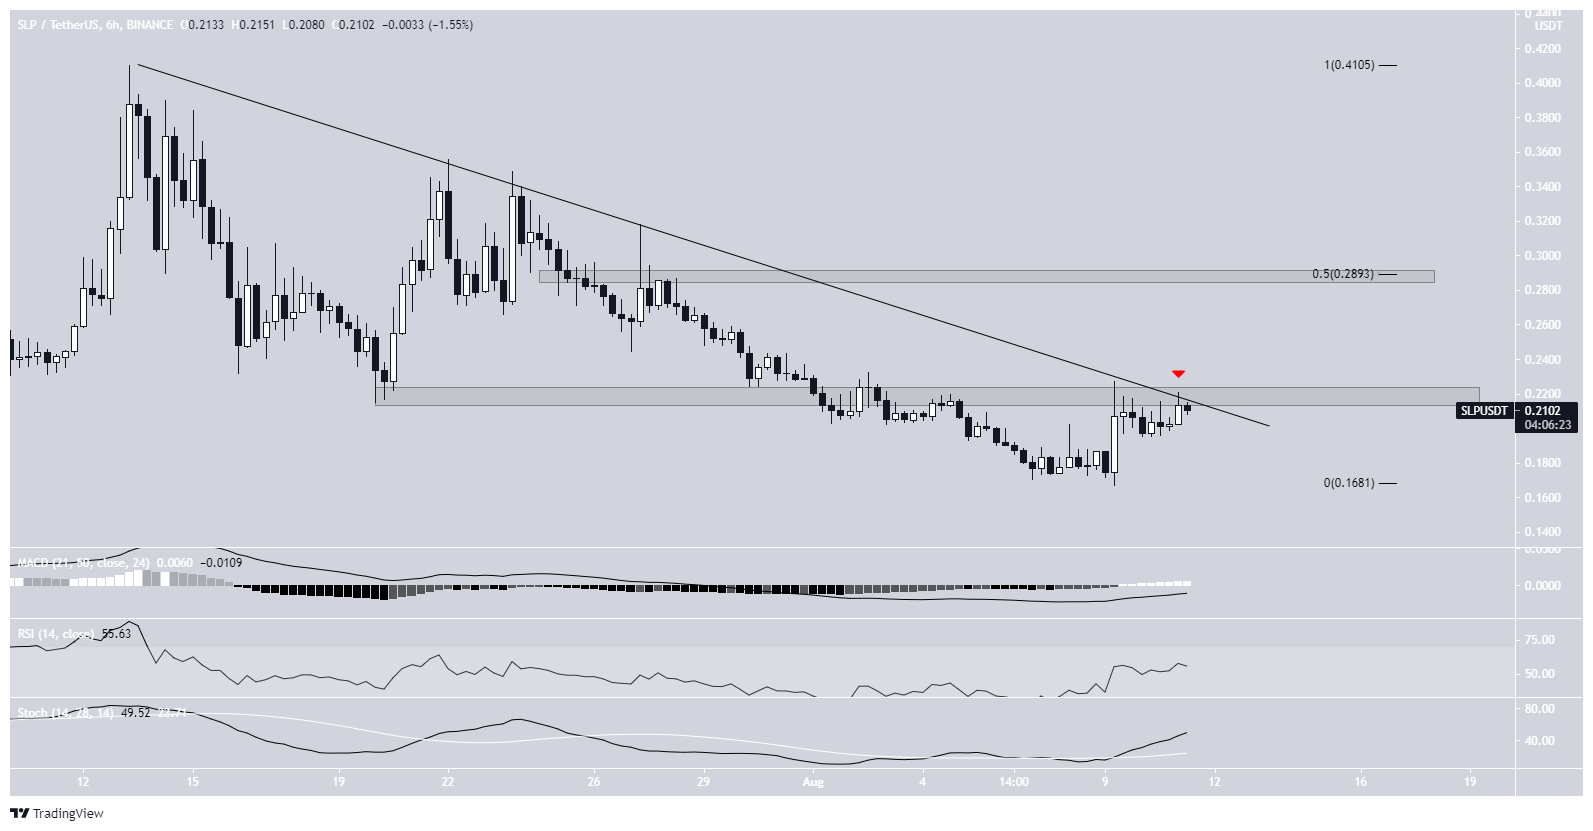
SLP
SLP has been following a descending resistance line since July 13. So far, it has made four unsuccessful breakout attempts, most recently on Aug 11 (red icon).
The resistance line also coincides with the $2.20 horizontal resistance area.
Until SLP manages to break out, the trend cannot be considered bullish.
The next resistance is found at $0.29. This target is the 0.5 Fib retracement level and a horizontal resistance area.
For BeInCrypto’s latest bitcoin (BTC) analysis, click here.