- The Graph token is struggling with the bearish trend for the long term.
- It is trading in a consolidation phase at the support zone after the bloodbath.
- GRT/BTC is trading positive by 0.22% at 0.00001365 BTC.
The Graph token is struggling in a bearish pattern, and GRT has strongly dominated the bulls for a long period. After its all-time high that GRT hit in mid-February at $2.88, the investors booked their profit and kept selling it.
GRT’s live price is $0.6415, with a volume of $109 million in the last 24-hours trading session. It is down by 4.79 % today, and we can see a significant change in volume at 6.75% gain from yesterday till now. That’s how GRT is showing weakness nowadays.
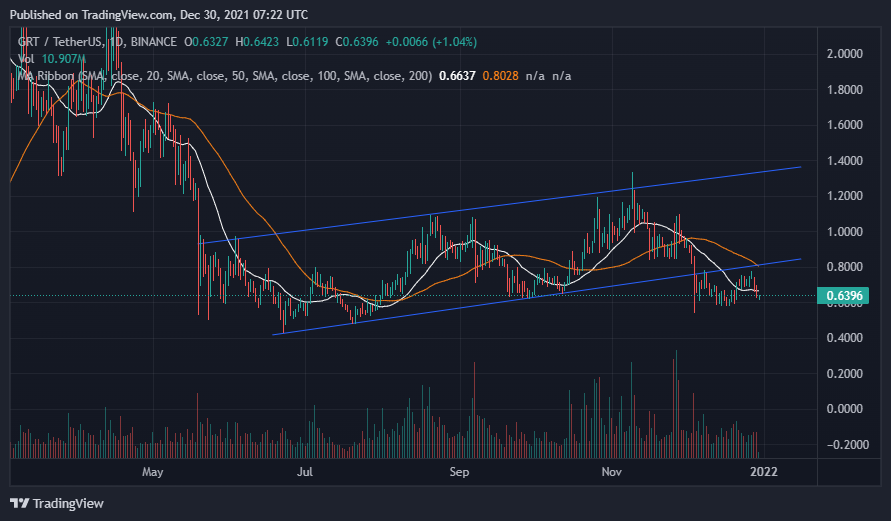
Bloodbath has come after its all-time high, and then until now, GRT obeyed the upwards ascending channel, and GRT tried to push up itself as soon as it broke down this channel. Now GRT is taking resistance near this channel’s support line. So any enormous momentum can happen when GRT breaches this resistance line with heavy volume.
GRT is trading under 20 and 50 Moving Average (MA) levels in a daily time frame. GRT is now testing the 20 Moving Average indicators for resistance in the short term. After that, 50 Moving Average levels will be the next resistance for the zone after a comeback upon 20 MA.
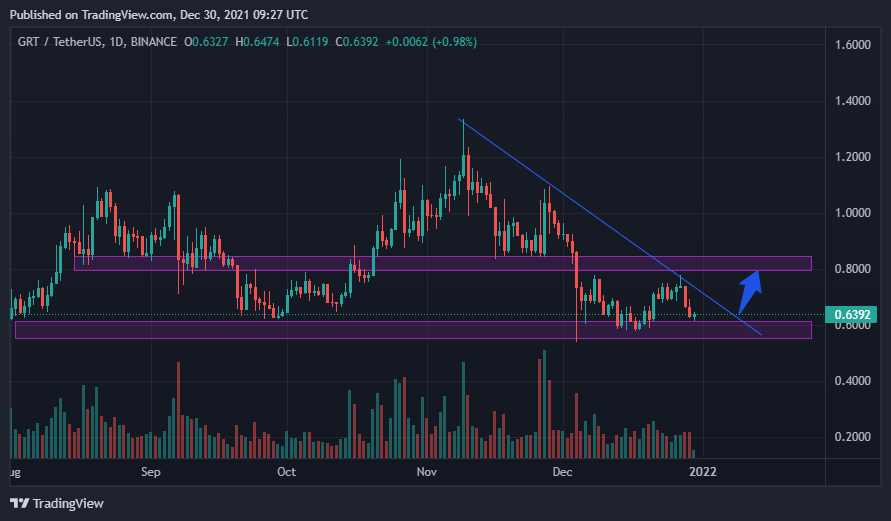
GRT is following the decline trendline for after mid-November when it comes near this trendline, so it is struggling with selling pressure, but the buyer is trying to stabilize GRT upon $0.6000.
It is trading in a short-range( $0.5000 to $0.8000), it seems GRT is in a consolidation phase ahead.
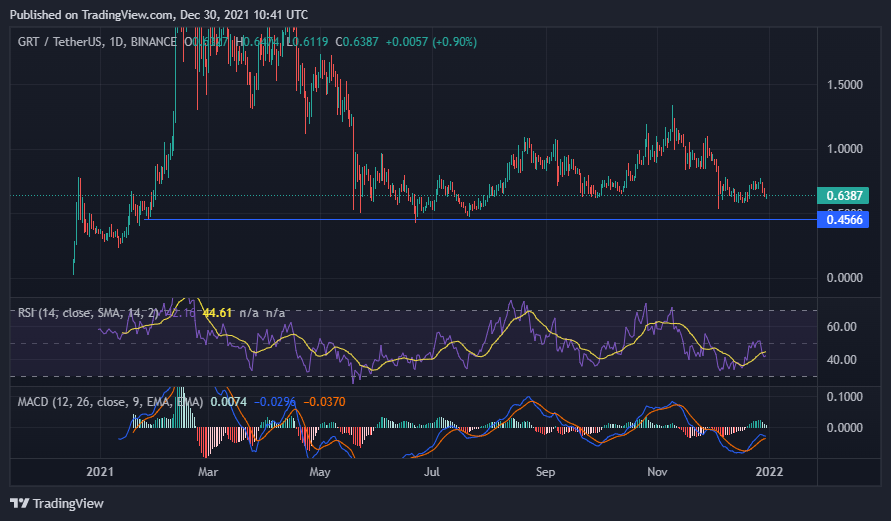
The relative strength (Bullish) index shows sideways tragedy, so we should ignore it for some time unless it shows a strong trend.
The MACD indicator is also in a soft uptrend because the crossover has done an upside trend but it could be sideways because of the battle between buyers and sellers.
Conclusion
The Graph Token is in a consolidation phase after the considerable correction, and it is trading in a concise range, so we should wait for its breakout. A bull run may happen when it breaks the $0.7500 price, and as soon as it breaks $0.4500, the sellers will remain strong again on buyers.
Resistance level- $ 1.200 USD
Support level- $ 0.45 USD
Disclaimer
The views and opinions stated by the author, or any people named in this article, are for informational ideas only, and they do not establish the financial, investment, or other advice. Investing in or trading crypto assets comes with a risk of financial loss.