- BNB price is trading towards the upper trendline of the consolidation phase over the daily price chart.
- BNB crypto is trading above 20 and 50 EMA and also trying for 100 and 200-days Daily Moving Average.
- The pair of BNB/BTC is at 0.01466 BTC with an intraday drop of 1.41%.
BNB price is currently trading at the 2021 lows and seeking to develop a strong upward momentum over the chart. The coin is trying to exit the consolidation phase and gain support from the bulls. If BNB currency is to emerge from the consolidation phase, it needs to entice additional buyers. Before the token dropped from BNB and was stuck inside a range-bound region, it first produced a symmetrical triangular pattern. In order to stop further chart erosion, BNB must exit the consolidation phase.
BNB price is now CMP at $285.8, a decline of 0.27% in market capitalization over the previous 24 hours. The volume of trades increased by a modest 35% during intraday trading. This indicates how BNB is currently having trouble keeping up bull support. Volume to market cap ratio is 0.01561.
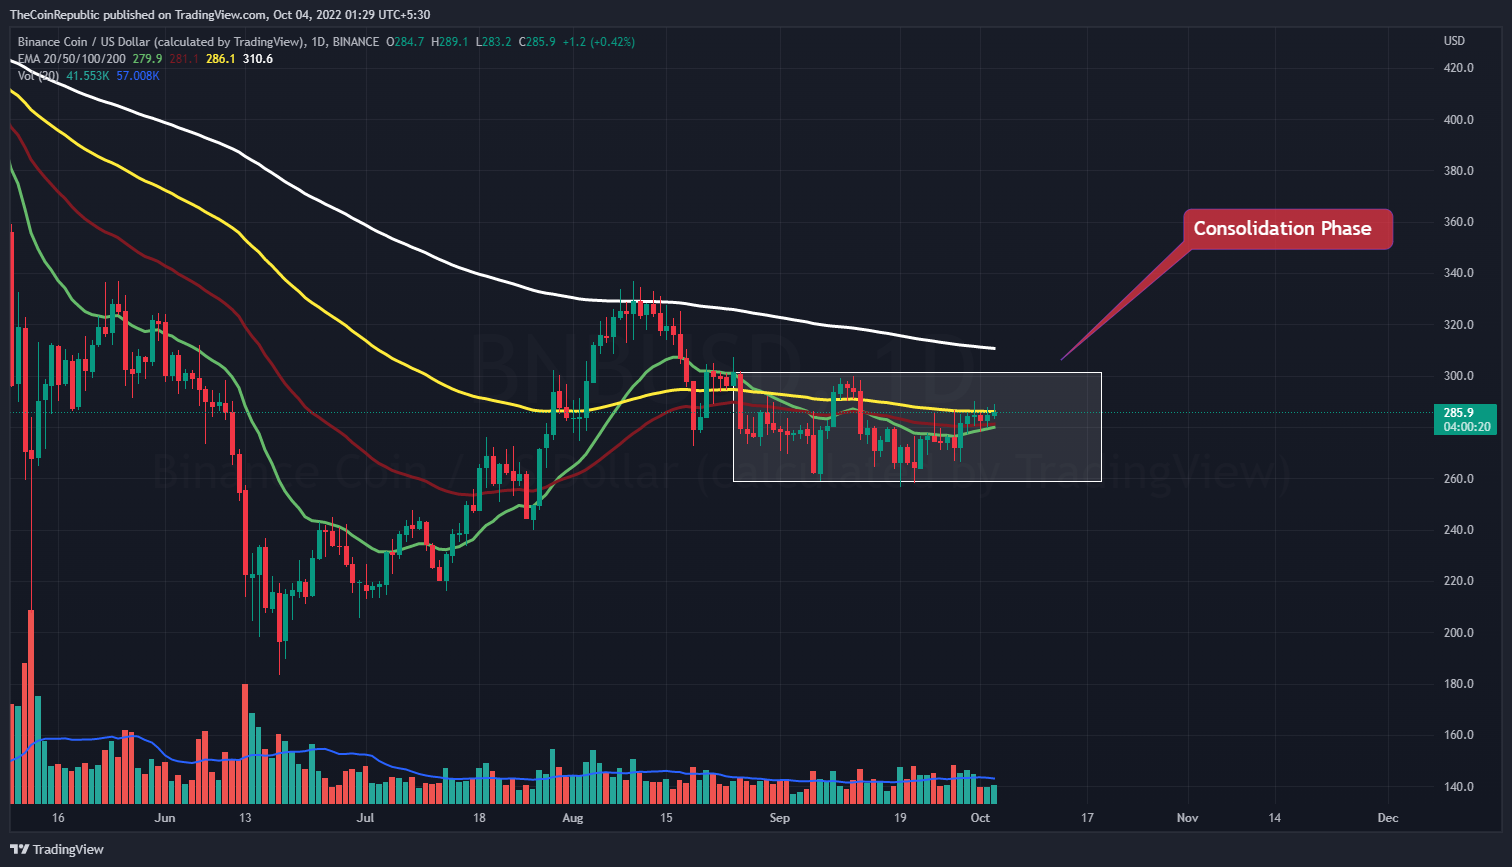
The price of BNB coin is seeking to exit the consolidation phase on the daily chart. The token requires assistance from bulls in order to break out of the pattern. BNB investors need to keep an eye on the daily chart for any changes in trend. Before making any assumptions regarding the movement of the coin, BNB investors must wait. Since it is moving below the average line on the chart and is constantly declining, the volume must rise to indicate the breakout of the BNB token.
What do Technical Indicators suggest about BNB?
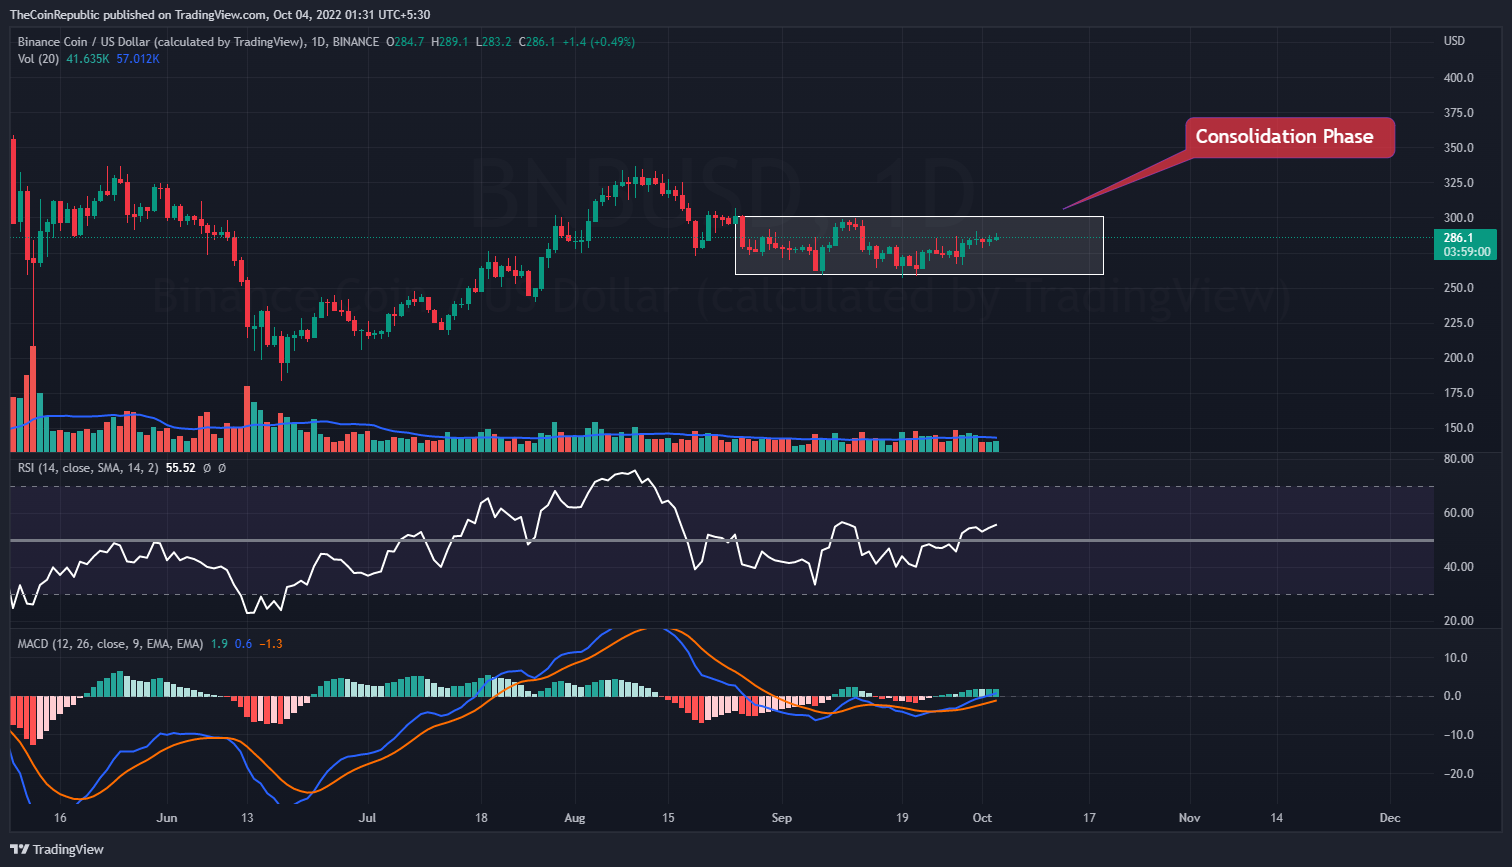
The BNB token is trapped inside a horizontal range-bound zone on the daily chart. The cryptocurrency is seeking to gain momentum in an uptrend on the chart. Technical indicators support the downward trend of BNB over the daily price chart. Relative Strength Index (RSI) displays the decline of BNB coin as it nears neutrality.
The MACD shows the time of consolidation for the BNB coin. Since the MACD line is above the signal line, BNB crypto appears to be recovering. To stop the movement of the BNB coin, investors must wait until one of the crosses.
Conclusion
BNB price is currently trading at the 2021 lows and seeking to develop a strong upward momentum over the chart. The coin is trying to exit the consolidation phase and gain support from the bulls. If BNB currency is to emerge from the consolidation phase, it needs to entice additional buyers. Before the token dropped from BNB and was stuck inside a range-bound region, it first produced a symmetrical triangular pattern. Before making any assumptions regarding the movement of the coin, BNB investors must wait. Since it is moving below the average line on the chart and is constantly declining, the volume must rise to indicate the breakout of the BNB token. Technical indicators support the downward trend of BNB over the daily price chart.
Technical Levels
Support Levels: $260
Resistance Levels: $300
Disclaimer
The views and opinions stated by the author, or any people named in this article, are for informational ideas only, and they do not establish the financial, investment, or other advice. Investing in or trading crypto assets comes with a risk of financial loss.