- Litecoin price is looking above the green zone of the Super Trend indicator amid a pullback.
- Buyers barely manage LTC crypto above the $50-key support level.
- The daily price candle is moving sideways below the bearish trend line.
Litecoin is following in the footsteps of the market leader – Bitcoin. Buyers are battling a bearish trend after the September 22 to September 23 price rally. The price remained below the bearish trend line (bottom of chart) over the weekend.
Litecoin moved sideways after a major price correction from the $65 to $70 resistance area. Sellers are playing this game well near this zone and have faced high price rejections at times. Meanwhile, again the LTC coin is trading at the $52.8 mark at the time of writing.
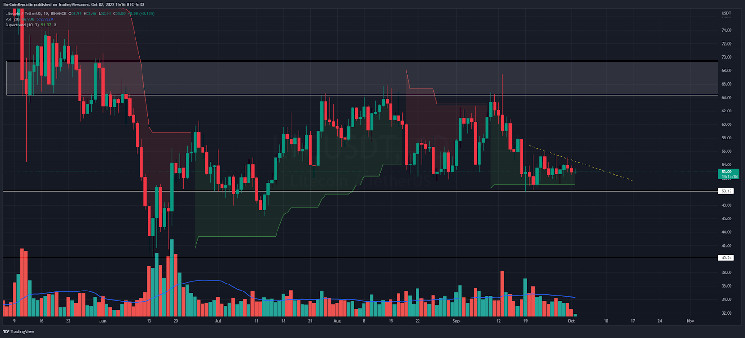
Buyers attempt to manage Litecoin price above the round level of $50, which stood to be an immediate support. Below this level buyers may see a downtrend until the annual bottom level of $40. Although the LTC coin is bearish, the moving speed is slightly slow. Besides, bulls need to escape the bearish trendline (dotted Yellow).
Trading volume is decreasing so far this week and speculators saw $259 Million volume last night. Despite the downtrend, Litecoin price is looking above the green zone of the super trend indicator amid pullback in terms of the daily price scale. Moreover, the LTC crypto belonging to the BTC pair is down 0.7% at 0.002752 satoshis.
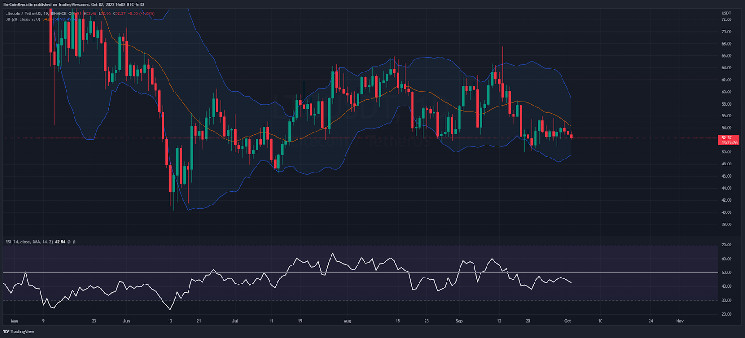
Lower Band The Bollinger Bands indicator acts as a support level. Thus LTC price is going down after reversing from mid-band (20 day moving average) in terms of daily price chart. Moreover, the daily RSI is showing sideways momentum as it reaches the 42 level.
Conclusion
Litecoin price is moving towards the $50-immediate support level. At this point, the middle band of the Bollinger Bands indicator acts as a resistance. Buyers need to break the downsloping trendline as soon as possible.
Resistance level- $64 and $100
Support level- $50 and $40
Disclaimer
The views and opinions stated by the author, or any people named in this article, are for informational ideas only, and they do not establish the financial, investment, or other advice. Investing in or trading crypto assets comes with a risk of financial loss.