- EOS price has dropped below the horizontal range-bound area over the daily price chart.
- EOS crypto is trading below 20, 50, 100 and 200-days Daily Moving Average.
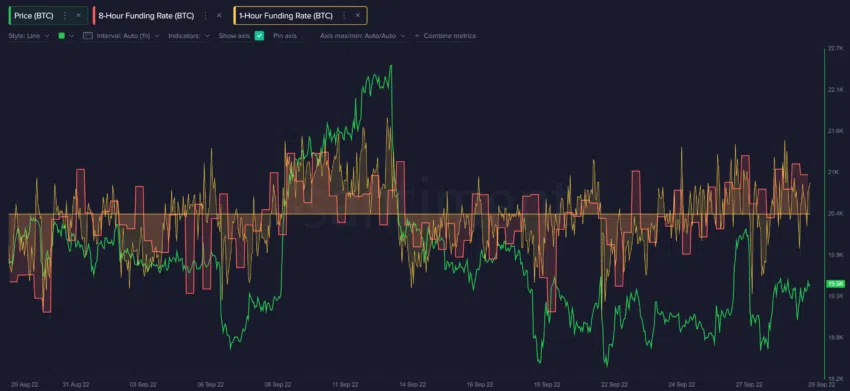
- The pair of EOS/BTC is at 0.00006151 BTC with an intraday gain of 3.25%.
The purchase of the EOS has been capped at a set amount from August 14. This existential crisis led to panic selling on the cryptocurrency market. Despite the extreme volatility of the bitcoin market, investors are making an effort to hang onto their own investments. EOS is one of the digital currencies experiencing an existential crisis as it teeters at a record low. During this turbulent moment, cryptocurrency investors need to be as rock-solid as those with diamond hands. Diamond hands won’t be as eager to sell their holdings as other players. However, during the intraday trading session, the coin fell below the consolidation phase, and it is now challenging for it to find support.
EOS’s price is currently $1.1811, up 3.92% from its market value of the day before. Transaction volume increased intraday by 3.70%. This suggests that investors are getting ready for the EOS coin’s rescue. Volume to market cap ratio is 0.2007.
On the daily price chart, the price of the EOS coin is clearly declining. Due to the market’s ongoing drop, the cryptocurrency asset has returned to the consolidation phase close to the lows of 2020. If the price of the EOS currency is to increase back to the upper price range of the consolidation period, more buyers must enter the market. The cost of EOS has been consistent between $1.25 to $1.95. The volume movement, which is now moderate in comparison to the usual, must increase for EOS currency to cross the daily chart.
What do Technical Indicators suggest about EOS?
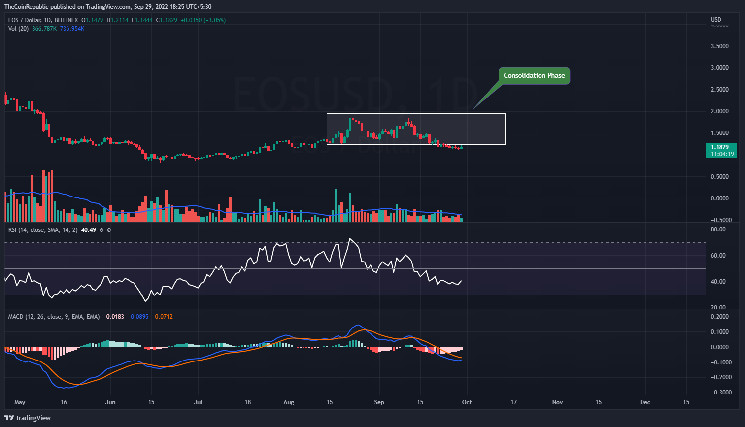
On the daily price chart, the price of EOS is rapidly declining. If the EOS currency wants to rise quickly toward the peak price range of the consolidation period, it must attract buyers. The daily chart’s technical indicators reflect the EOS coin’s rising momentum.
The relative strength indicator indicates that the value of the EOS currency is rising. The RSI is getting close to neutrality at 40. The EOS cryptocurrency’s MACD displays a bullish momentum. A positive crossover occurs when the MACD line climbs and passes the signal line. Investors in EOS should monitor the daily chart for any shifts in trend.
Conclusion
The purchase of the EOS has been capped at a set amount from August 14. This existential crisis led to panic selling on the cryptocurrency market. Despite the extreme volatility of the bitcoin market, investors are making an effort to hang onto their own investments. EOS is one of the digital currencies experiencing an existential crisis as it teeters at a record low. During this turbulent moment, cryptocurrency investors need to be as rock-solid as those with diamond hands. Diamond hands won’t be as eager to sell their holdings as other players. The cost of EOS has been consistent between $1.25 to $1.95. The volume movement, which is now moderate in comparison to the usual, must increase for EOS currency to cross the daily chart. The daily chart’s technical indicators reflect the EOS coin’s rising momentum. A positive crossover occurs when the MACD line climbs and passes the signal line. Investors in EOS should monitor the daily chart for any shifts in trend.
Technical Levels
Support Level: $1.10 and $1.00
Resistance Level: $1.25 and $1.50
Disclaimer
The views and opinions stated by the author, or any people named in this article, are for informational ideas only, and they do not establish the financial, investment, or other advice. Investing in or trading crypto assets comes with a risk of financial loss.