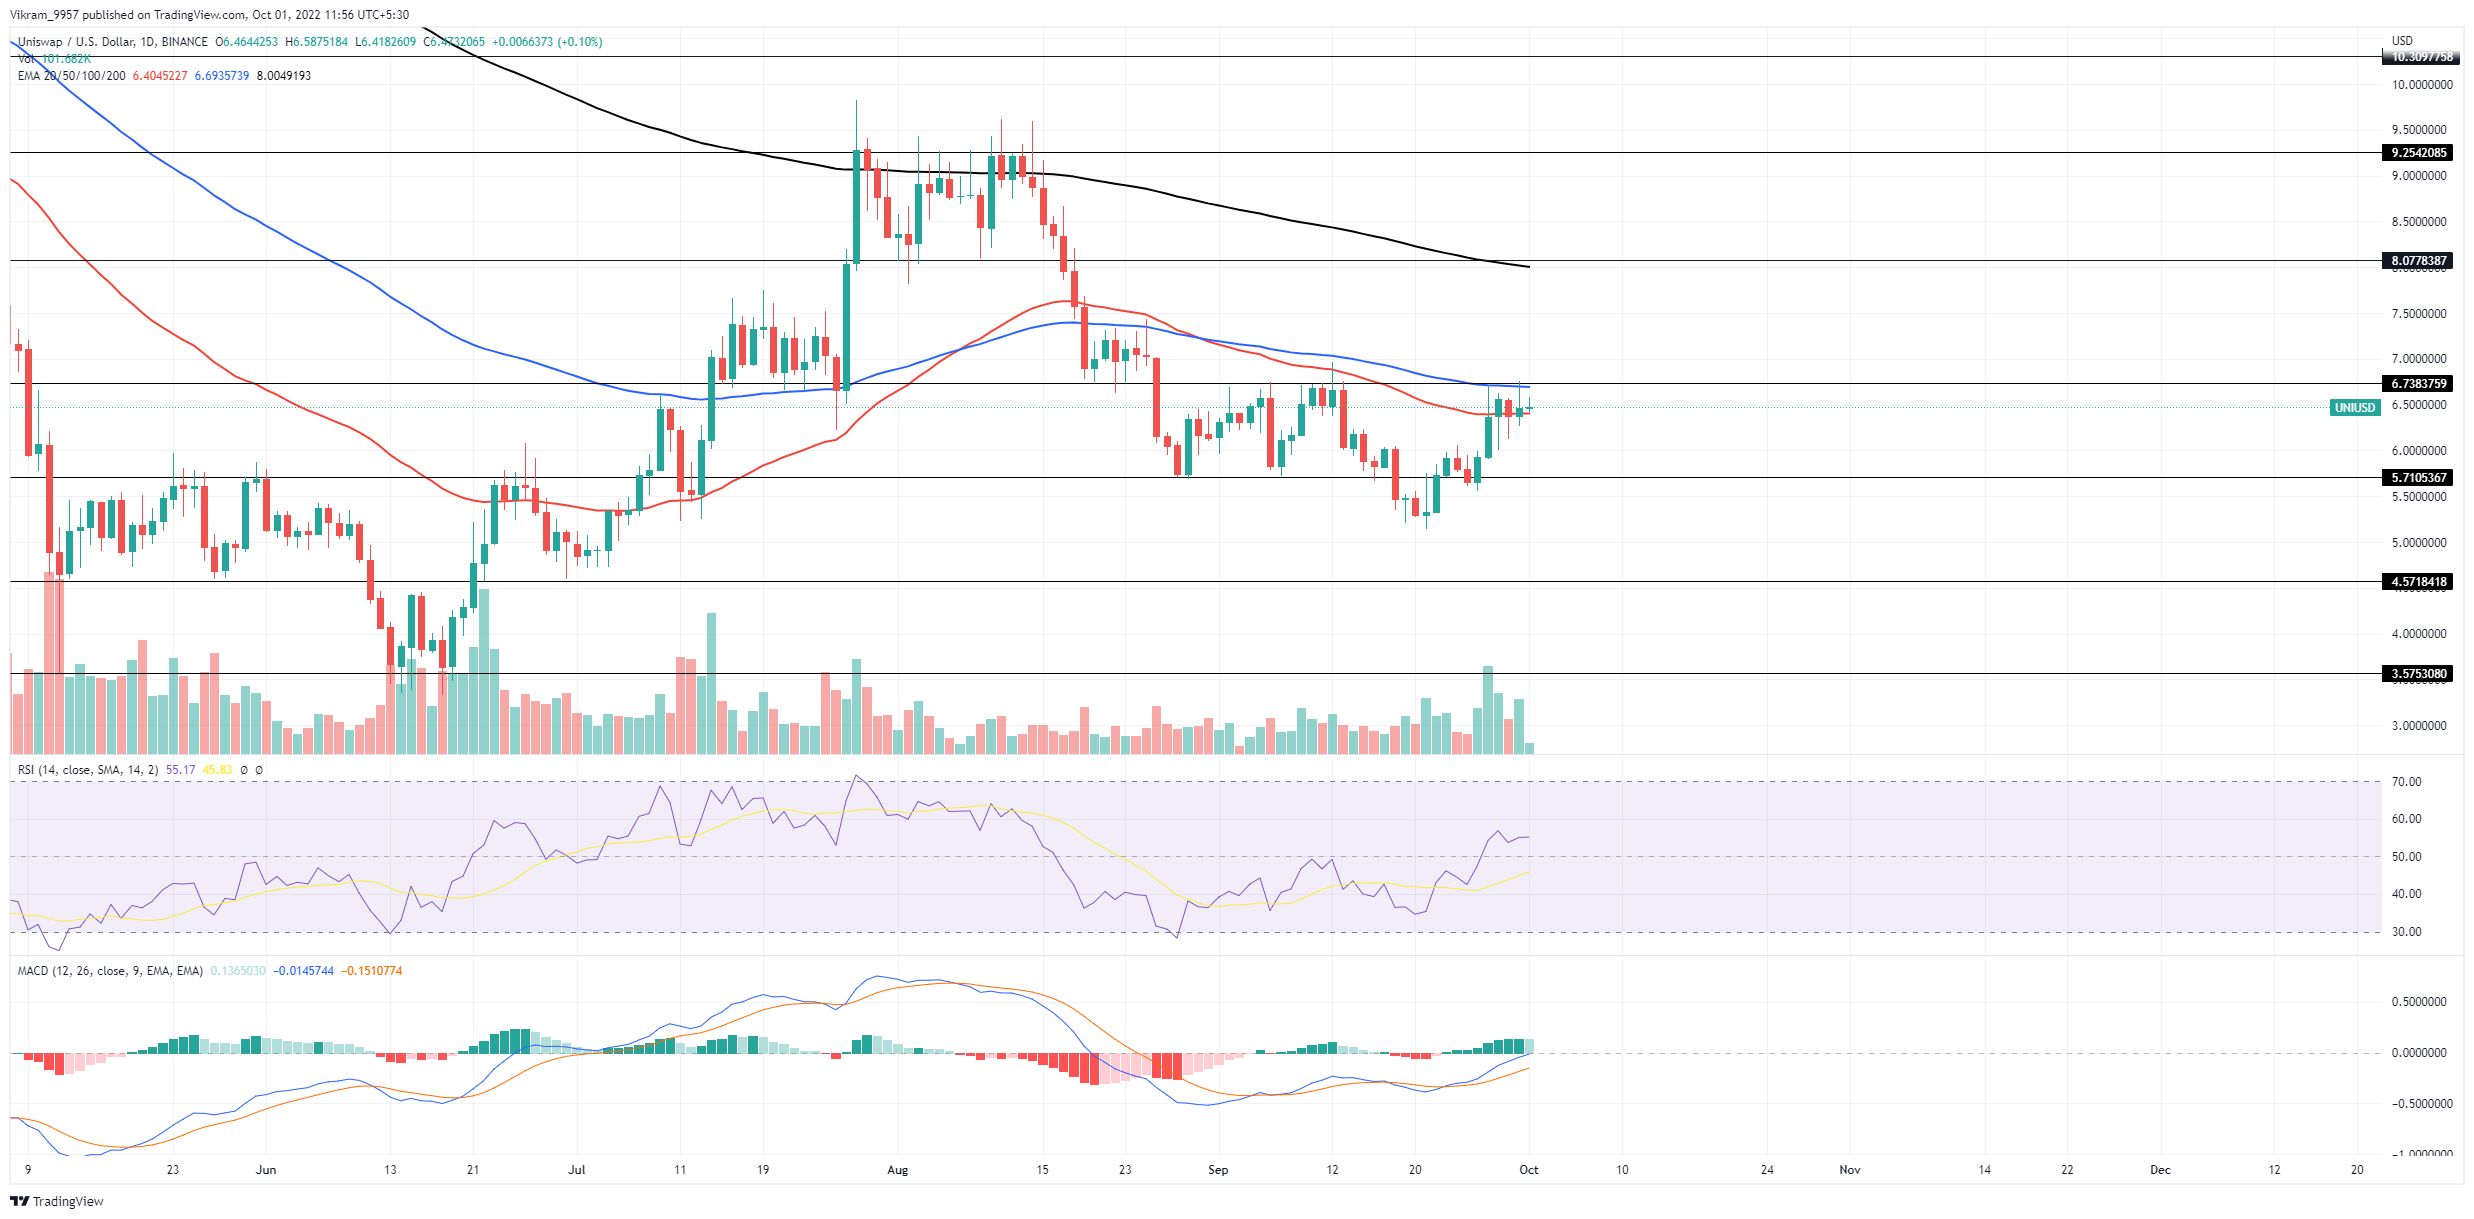
The UNI Technical Analysis displays a bullish weakness to cross above the 100-day EMA despite a phenomenal increase of 25% over the last two weeks. The UNI price action displays a rising trend approaching the overhead resistance of the 100-day EMA at $6.7. Currently, the price action shows a consolidation between the $6.7 mark and the 50-day EMA, with multiple low price rejection candles increasing the bullish breakout. So, should you consider taking in early bullish trade in Uniswap?
Key Points:
- The Uniswap price action shows multiple low price rejection candles in the daily chart.
- The bullish break of the consolidation range will result in a bullish crossover of the 50 and 100-day EMA.
- The intraday trading volume in Uniswap is $168 million.
 Source - TradingView
UNI Technical Analysis
The UNI price action displays a bearish failure to knock down the crucial psychological support level of $5, resulting in a bullish reversal. The recovery rally account for a price of 25% in the last two weeks and challenges the 100-day EMA. Currently, the price action displays the consolidation range between the 50 and 100-day EMAs below the overhead resistance of $6.7. In addition, the increase in trading volume supports the lower price rejection candles increasing the possibility of a bullish breakout. Therefore, sideline traders can shortly expect a bullish entry opportunity with the breakout of the resistance confluence. The breakout of $6.7 will unleash the trapped bullish momentum resulting in a spike to the 200-day EMA. Additionally, the 20% price jump will potentially result in a bullish crossover of the 50 and 100-day EMA. Conversely, the bearish breakout of the 50-day EMA will result in a 10% drop to $5.7 and prolong the consolidation range.
Technical Indicators
The RSI slope spikes from the oversold boundary to spike above the halfway line, reflecting an increase in the underlying bullishness. Moreover, the bullish crossover in the MACD indicator reflects increasing buying pressure projecting a potential bullish breakout. Therefore, the technical indicators show a growing bullish inclination in the underline sentiments. As a result, the UNI technical analysis forecasts a bullish breakout of the $1.20 breakout. Resistance Levels - $6.7 and $8 Support Levels - $5.7 and $5
 cryptoknowmics.com