The SNX Technical Analysis shows the declining trend reaching the $2.2 support zone under a resistance trendline's influence. The SNX price action displays a bullish reversal from the $2.2 mark coinciding with the 78.60% Fibonacci level. In addition, the recovery rally challenges the long-coming resistance trendline teasing a bullish breakout as the buying pressure increases. So, is it the right time to buy Synthetix at this price?
Key Points:
- The Synthetix price action teases a breakout entry opportunity.
- The SNX price action shows a double-bottom reversal possibility.
- The intraday trading volume in Synthetix is $94.31 million.
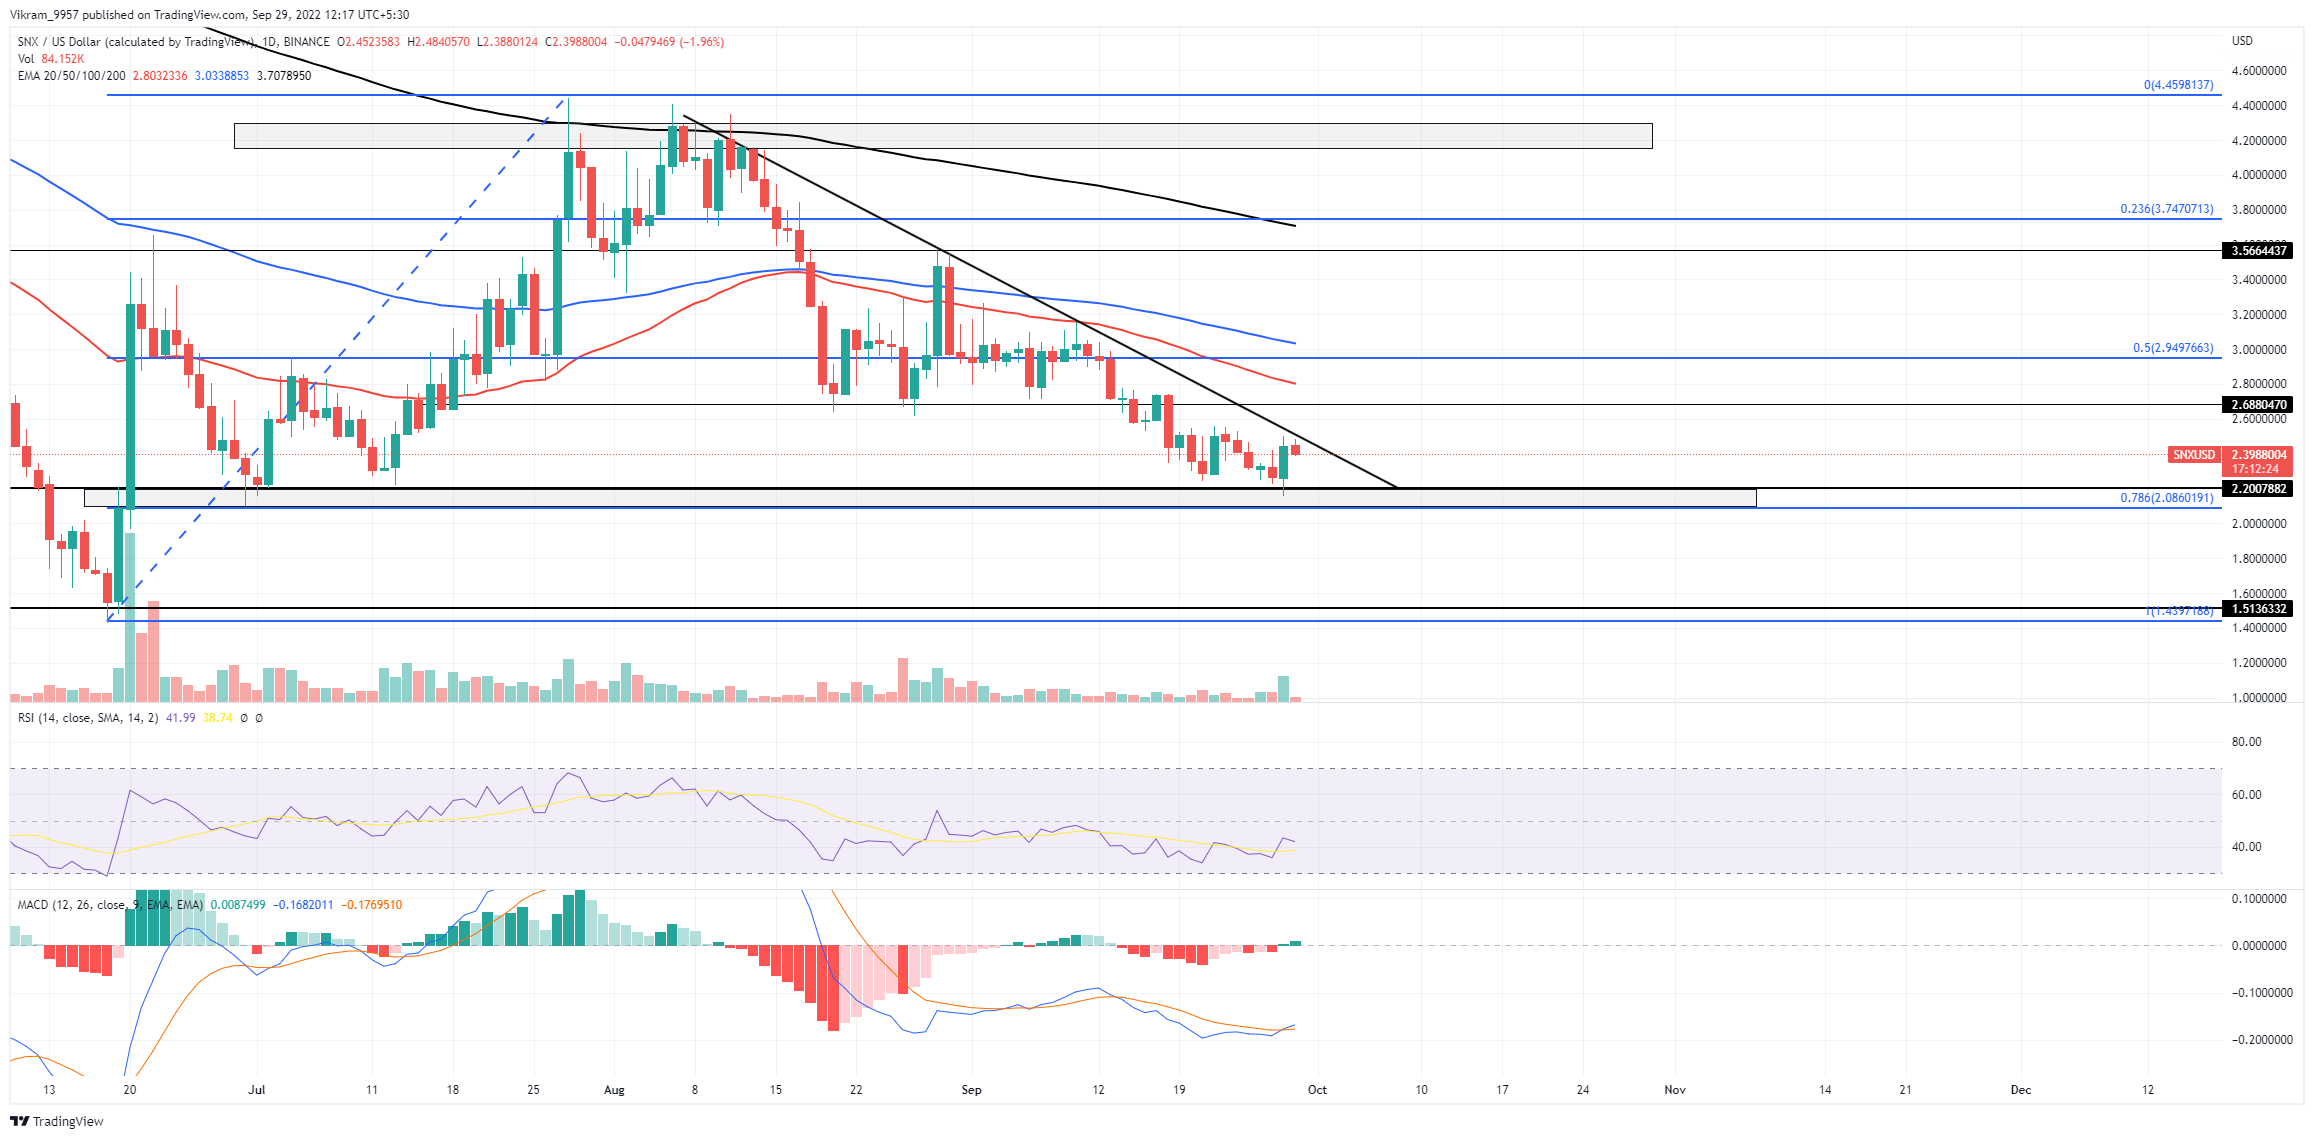 Source - TradingView
SNX Technical Analysis
The SNX price action displays the declining trend under the influence of a resistance trendline accounting for a price drop of 42% within two months. After breaking multiple support levels, currently, the price takes support at the $2.20 demand zone coinciding with the 78.60% Fibonacci level. At the support confluence, the SNX price action displays a double bottom pattern at $2.20, ready to bounce the prices back above the resistance trendline. Hence, the sideline traders can find a bullish Breakout entry opportunity shortly. Additionally, the spike in buying pressure supporting the recently formed bullish engulfing candle reflects an improvement in the underlying sentiments. Upon successful trendline breakout, the SNX price action will show an uptrend to the $3 mark if it exceeds the 50-day EMA. Conversely, if the sellers dump the price under $2.20, the SNX market price will tumble to the bottom support at $2.
Technical Indicators
The RSI slope displays a spike crossing the 14-day SMA under the halfway line, reflecting a slight surge in the underlying bullishness. Moreover, the MACD indicator shows the bullish spread increasing between the fast and slow lines after the recent crossover. Therefore, the technical indicators imply a growth of bullish influence over the underlying sentiments. As a result, the SNX technical analysis takes an optimistic standpoint and forecasts a bullish breakout. Resistance Levels - $2.5 and $3 Support Levels - $2.2 and $2