Bitcoin’s (BTC) price rose 2.4% on Wednesday on above-average volume compared with its 20-day moving average. Bitcoin started the day in positive territory as traditional U.S. markets opened, logging four consecutive positive candles on its hourly chart. A trading candle represents the open, high, low and close price for an asset during a selected time frame. The largest cryptocurrency by market cap reclaimed the $19,000 price point, but continues to trade below the psychologically important $20,000 mark.
Ether (ETH) was roughly flat, falling 0.07% on moderate volume. The price of the second-largest cryptocurrency by market cap has fallen 19% since the Ethereum network’s Sept. 15 conversion from proof-of-stake to proof-of-work. ETH’s value compared with BTC has fallen 21% relative to BTC over the same time frame. Ether supply has increased by 8,400 ETH since the Merge. Absent the Merge, ETH supply would have grown by approximately 167,000 ETH over the same time frame.
The CoinDesk Market Index (CMI), a broad-based market index that measures performance across a basket of cryptocurrencies, declined 0.35%
Economic Calendar: Wholesale inventories rose by more than expected, increasing 1.3% versus estimates of 0.3%.
Higher inventory levels may signal an economic slowdown, which would please the Federal Reserve in its efforts to tame inflation by decelerating economic growth.
Year over year, pending home sales decreased 24% in August, the largest decrease since April 2020, and larger than the consensus estimate of a 23% decline.
While not released Wednesday, consumer revolving credit figures, released Sept. 8 showed revolving debt increased 11% annually for the month of July. Given the extent to which retail investors participate in crypto markets, increases in revolving credit debt is likely to suppress the amount of capital available to purchase additional assets.
Currently, digital asset markets are navigating a challenging environment of high inflation, inverse correlations to the U.S. dollar, increasing interest rates and higher consumer debt.
U.S. Equities: Traditional equities were higher across the board as the Dow Jones Industrial Average (DJIA), tech-heavy Nasdaq composite and S&P 500 rose 1.9%, 2% and 1.97%, respectively.
Commodities: WTI crude rose 4.4% while European Brent crude rose 3.2%, marking the second consecutive day of increases for both. Natural gas rose 3.6% following a 3% decline on Tuesday. In metals, gold prices increased 2%, while copper futures increased 3%.
Latest Prices
● Bitcoin (BTC): $19,559 +3.0%
● Ether (ETH): $1,350 +2.0%
● CoinDesk Market Index (CMI): $963 +1.8%
● S&P 500 daily close: 3,719.04 +2.0%
● Gold: $1,668 per troy ounce +2.8%
● Ten-year Treasury yield daily close: 3.71% −0.3
Bitcoin, ether and gold prices are taken at approximately 4pm New York time. Bitcoin is the CoinDesk Bitcoin Price Index (XBX); Ether is the CoinDesk Ether Price Index (ETX); Gold is the COMEX spot price. Information about CoinDesk Indices can be found at coindesk.com/indices.
Technical Take
Bitcoin approaches its 20-day moving average
Bitcoin moved higher on Wednesday, approaching its 20-day moving average on above-average volume. The increase marks the third consecutive day where BTC’s price has traded in the opposite direction from the previous day.
As indicated in prior Market Wraps, BTC appears poised to trade relatively flat as prices have tended to revert more to its mean rather than trend in a particular direction. In the aggregate, BTC prices are trading near the same levels they were in June.
A look at BTC’s hourly chart shows a string of five consecutive hours of positive price action, beginning at 12:00 UTC (8:00 a.m. ET).
Applying Bollinger Bands to the hourly chart highlights the tendency for BTC prices to move to extremes before reverting to the mean (average) price.
Bollinger Bands are a technical indicator that measures an asset’s 20-day moving average, and plots two standard deviations above and below that average. Statistically, an asset’s price is expected to remain within two standard deviations of its average 95% of the time.
On the hourly chart, traders likely noticed the breach of the upper Bollinger band during the 16:00 UTC hour, in conjunction with a rising Relative Strength Index indicator. RSI measures an asset’s momentum, providing signals when an asset’s price may be approaching overvalued or undervalued status.
Also of note is that trading volume during that time frame began to decline relative to its average, implying that intraday bullish sentiment is beginning to turn.
Moving from the hourly to the daily chart paints a broader scale look at the results of intraday action. In this case, BTC’s price is moving toward the midpoint of its Bollinger Bands, while the RSI reading of 47 is relatively neutral.
The combination of factors on both larger and smaller time frame charts speaks to an asset poised to oscillate between slightly above to slightly below its average price, with traders looking to benefit in the short term on the price swings.
Derivatives markets seem to be implying the same, as funding rates for bitcoin have been alternating between positive and negative over the most recent week. Funding rates represent payments between buyers and sellers of futures contracts and can be used to measure market sentiment.
When rates are positive, buyers are likely driving the market. The opposite is true when funding rates are negative. Currently, BTC funding rates are positive but just slightly over zero, and less positive than the day before.
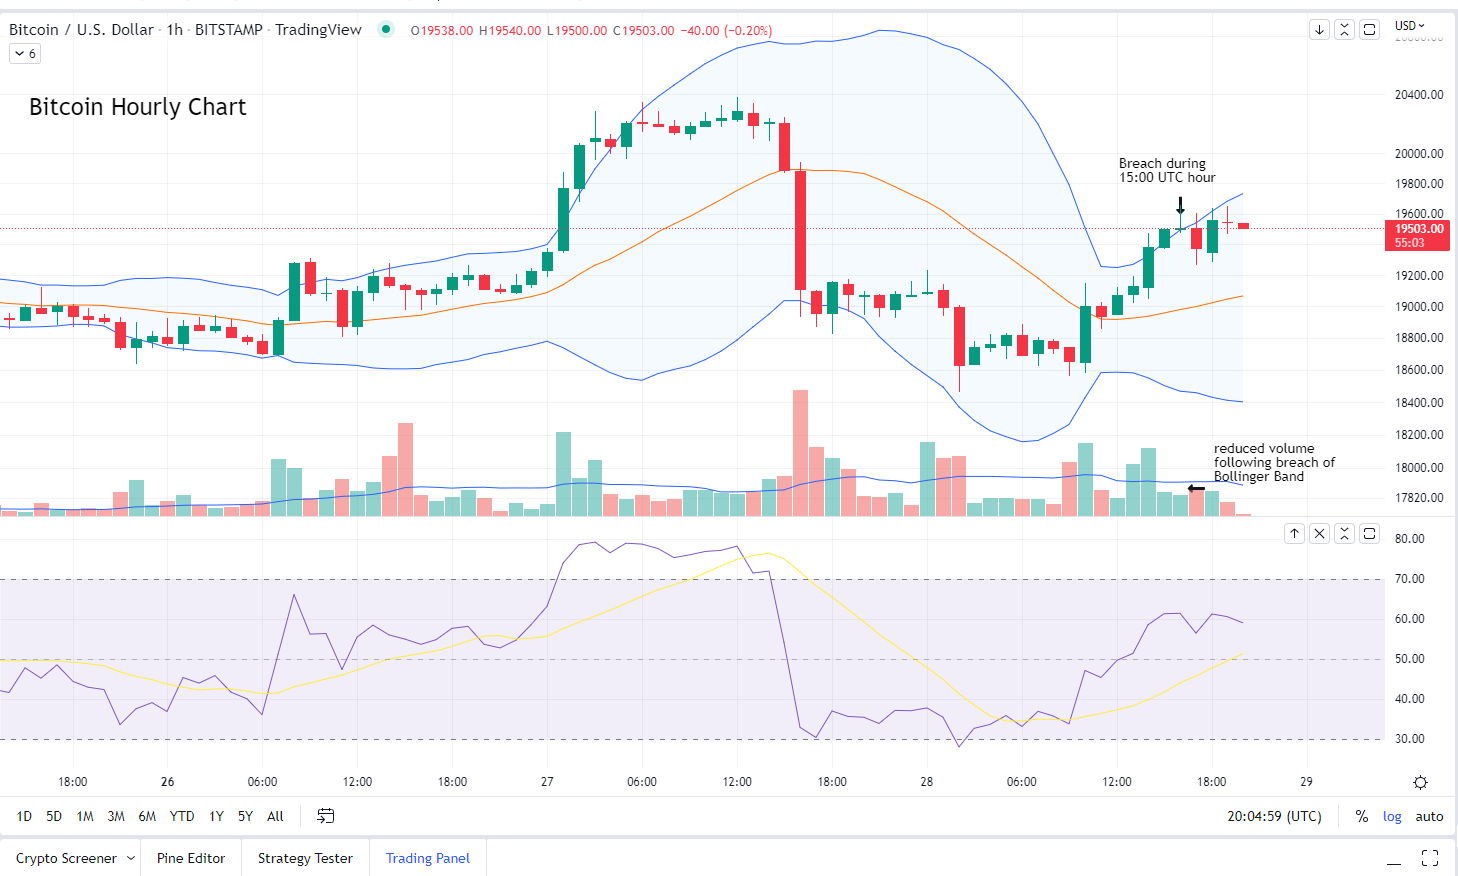
Bitcoin-U.S. Dollar Hourly Chart (Glenn Williams Jr/TradingView)
CoinDesk Market Index
Biggest Gainers
| Asset | Ticker | Returns | DACS Sector |
|---|---|---|---|
| Ethernity Chain | ERN | +24.88% | Culture & Entertainment |
| Alchemy Pay | ACH | +9.24% | Currency |
| Synthetix | SNX | +8.74% | DeFi |
Biggest Losers
| Asset | Ticker | Returns | DACS Sector |
|---|---|---|---|
| Ribbon Finance | RBN | -6.84% | DeFi |
| Tribe | TRIBE | -5.72% | DeFi |
| Maple | MPL | -4.58% | DeFi |
Sector classifications are provided via the Digital Asset Classification Standard (DACS), developed by CoinDesk Indices to provide a reliable, comprehensive and standardized classification system for digital assets. The CoinDesk Market Index (CMI) is a broad-based index designed to measure the market capitalization weighted performance of the digital asset market subject to minimum trading and exchange eligibility requirements.