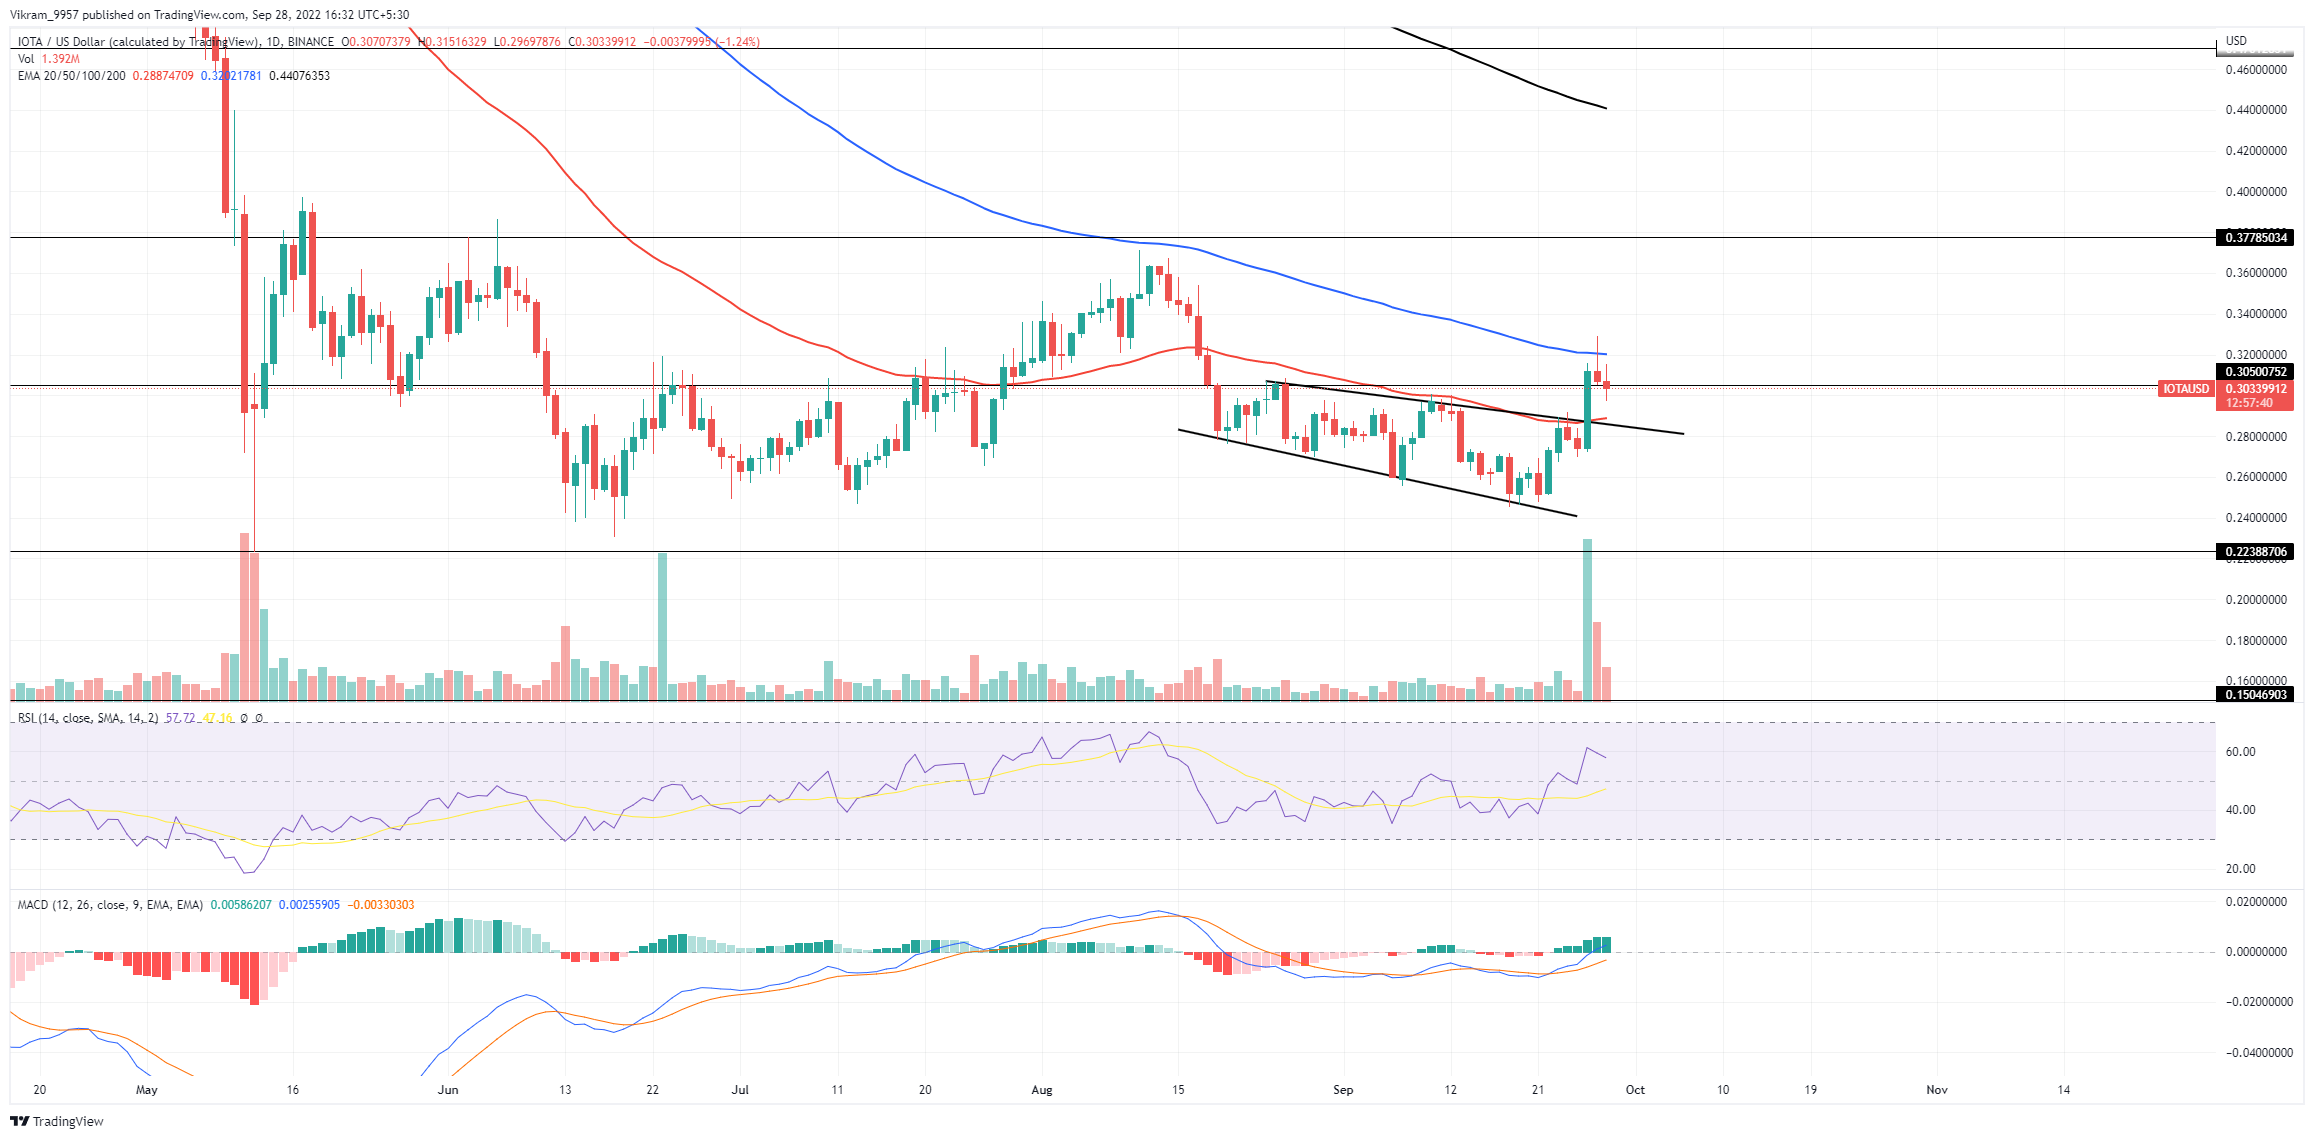
The IOTA Technical Analysis shows a channel breakout rally reversing from the 100-day EMA to retest. So, should you consider buying this retest? The IOTA price action displays the bullish candle forming on 26th September breaking the resistance trendline. However, the increased supply at the 100-day EMA reverses the trend to retest the bullish breakout. So, should you consider buying more during this retest phase?
Key Points:
- The IOTA price action teases a retest entry opportunity.
- The MACD indicator shows an increasing bullish spread.
- The intraday trading volume in IOTA is $42.77 million.
 Source - TradingView
IOTA Technical Analysis
The IOTA price action shows a bullish reversal from the support trendline of a falling channel breaking the resistance trendline. With a 24% jump within five days, including the bullish engulfing candle of 13% on the last day, bulls undermine the 18% drop within the bearish pattern. The reversal rally breaks the 50-day EMA and the $0.30 horizontal level with the support of increased trading volume. However, due to the high supply inflow at 100-day EMA, the price trend took a bearish turnaround resulting in a retest of the broken level with two Doji candles. Based on the price action analysis, the Doji candles represent a reversal possibility when formed at areas of interest. Hence, the retest at $0.30 comes as a bullish entry opportunity for the sideline traders. Upon successful post-retest reversal, the IOTA price action will show an uptrend to the $0.37 mark if it exceeds the 100-day EMA. Conversely, if the sellers dump the price under the 50-day EMA, the IOTA market price will tumble to the bottom support at $0.24.
Technical Indicators
The RSI slope spikes above the halfway line, reflecting a surge in the underlying bullishness. Moreover, the MACD indicator shows the bullish spread increasing between the fast and slow lines, displaying growth in buying pressure. Therefore, the technical indicators imply a growth of bullish influence over the underlying sentiments. As a result, the IOTA technical analysis takes an optimistic standpoint and suggests a reversal entry at $0.30. Resistance Levels - $0.32 and $0.37 Support Levels - $0.30 and $0.24
 cryptoknowmics.com