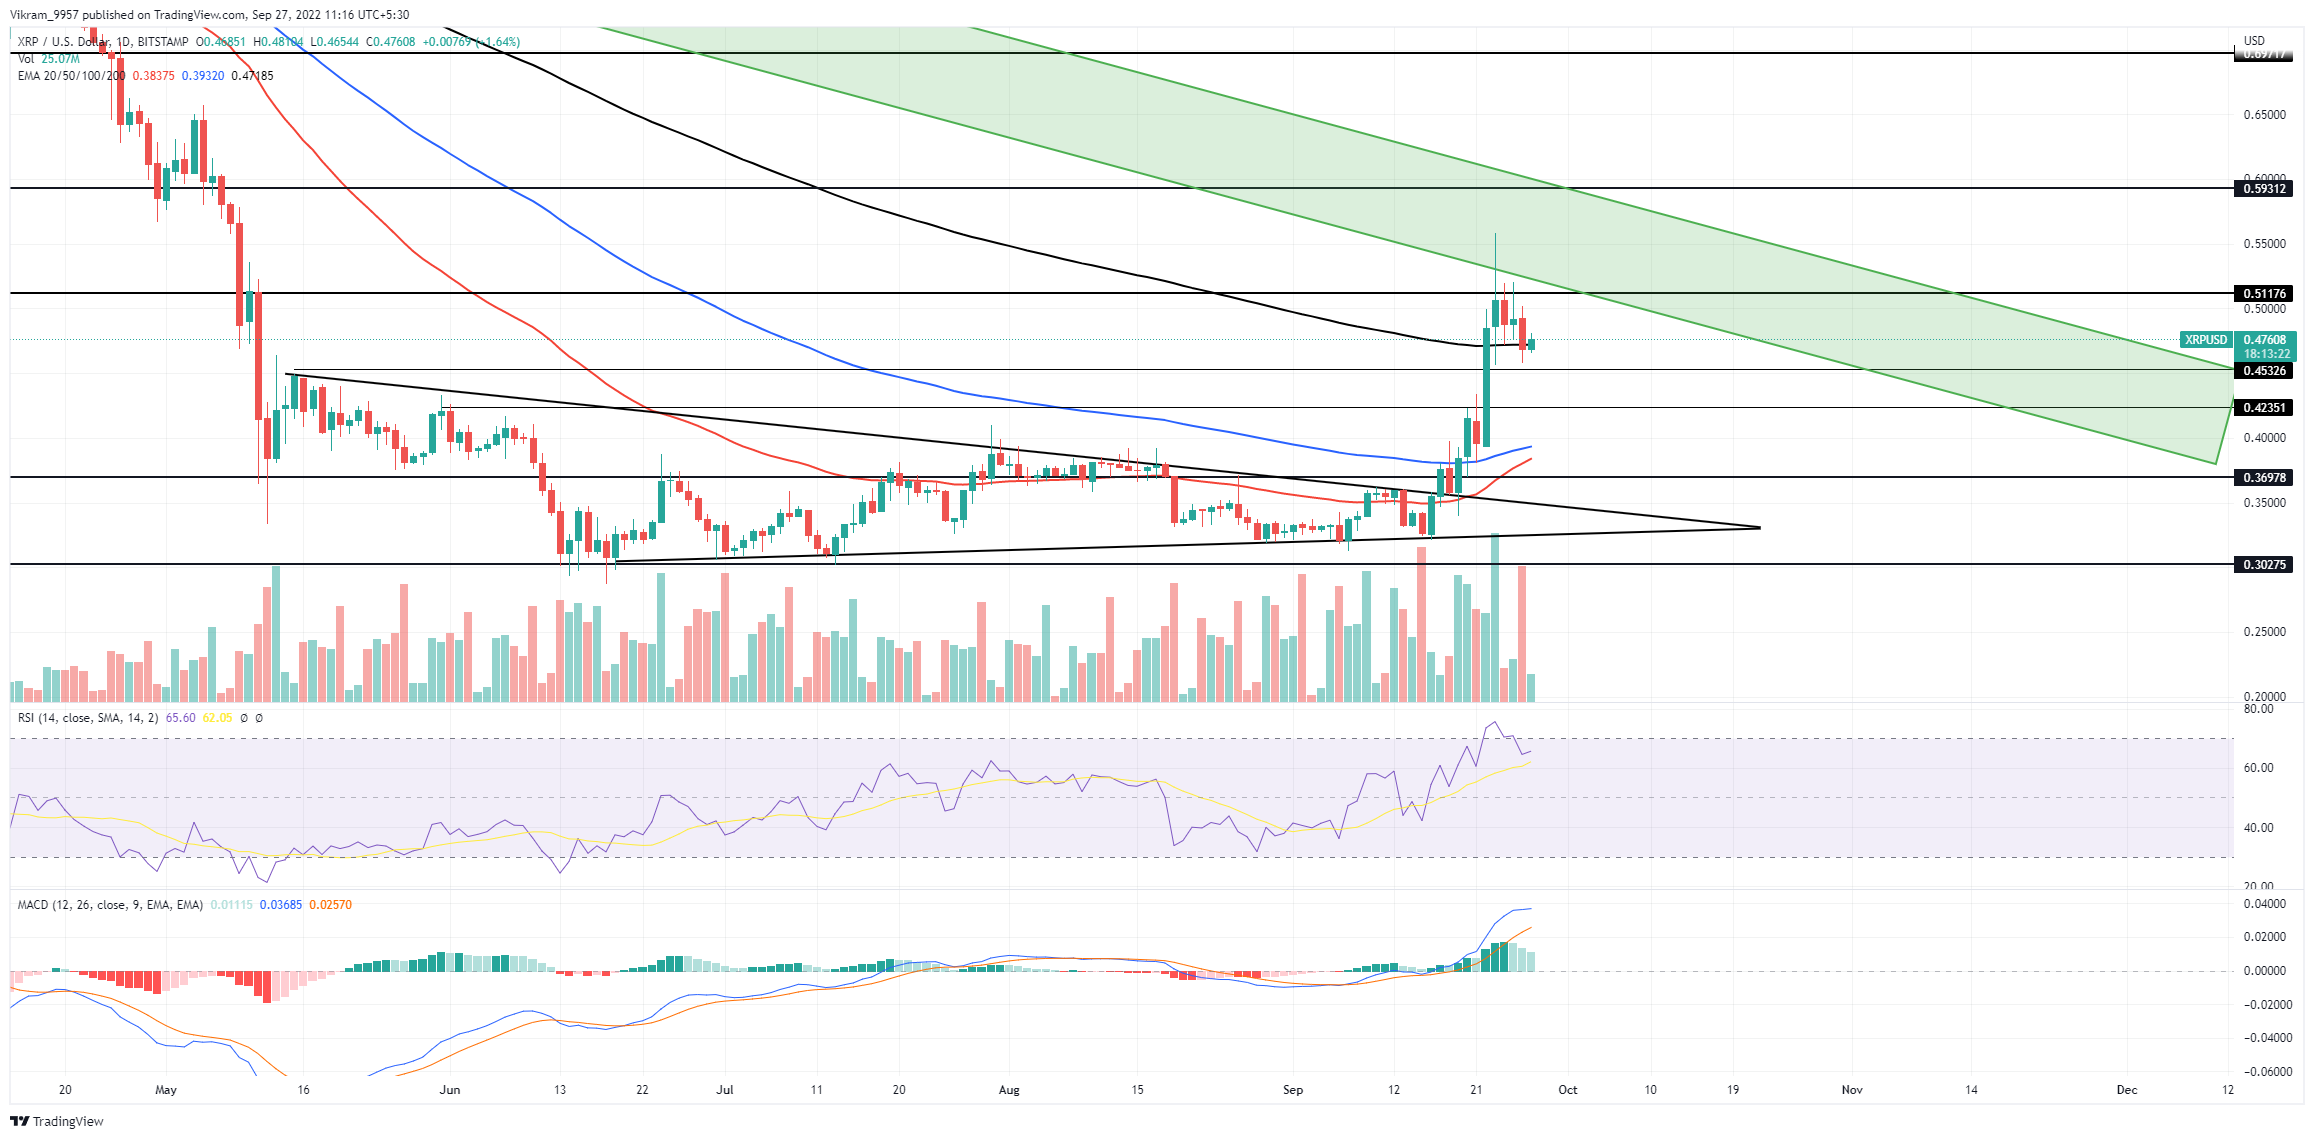
The XRP Technical Analysis shows a recovery rally challenging the 200-week EMA. Should you consider joining the hype in hopes of a breakout? The XRP price action shows a bullish reversal with a triangle breakout leading to a price of 30%. Currently, on the technical chart, the Ripple prices face a descending supply slope, challenging the breakout rally as it crosses the $0.50 psychological mark. So should you consider buying Ripple as the prices rest at the 200-day EMA?
Key Points:
- The Ripple prices show a bull cycle reaching the 200-week EMA.
- The triangle breakout rally sustains above the $0.40 mark.
- The intraday trading volume in Ripple is $2.84 billion.
 Source - TradingView
XRP Technical Analysis
As mentioned in our previous analysis, the XRP price breaks the 100-day EMA to reach the $0.42 mark. However, the increased buying pressure prolongs the uptrend to the psychological mark of $0.50. Currently, the price action displays the growth of 40% resulting in bullish engulfing candlesticks and beating the 200-day EMA. However, a lack of support in the intraday trading volume is evident during the bullish candles. Thus, the prices revert to retest the 200-day EMA resulting in a dip of 7.42% and avoiding a closing above the $0.50 mark. 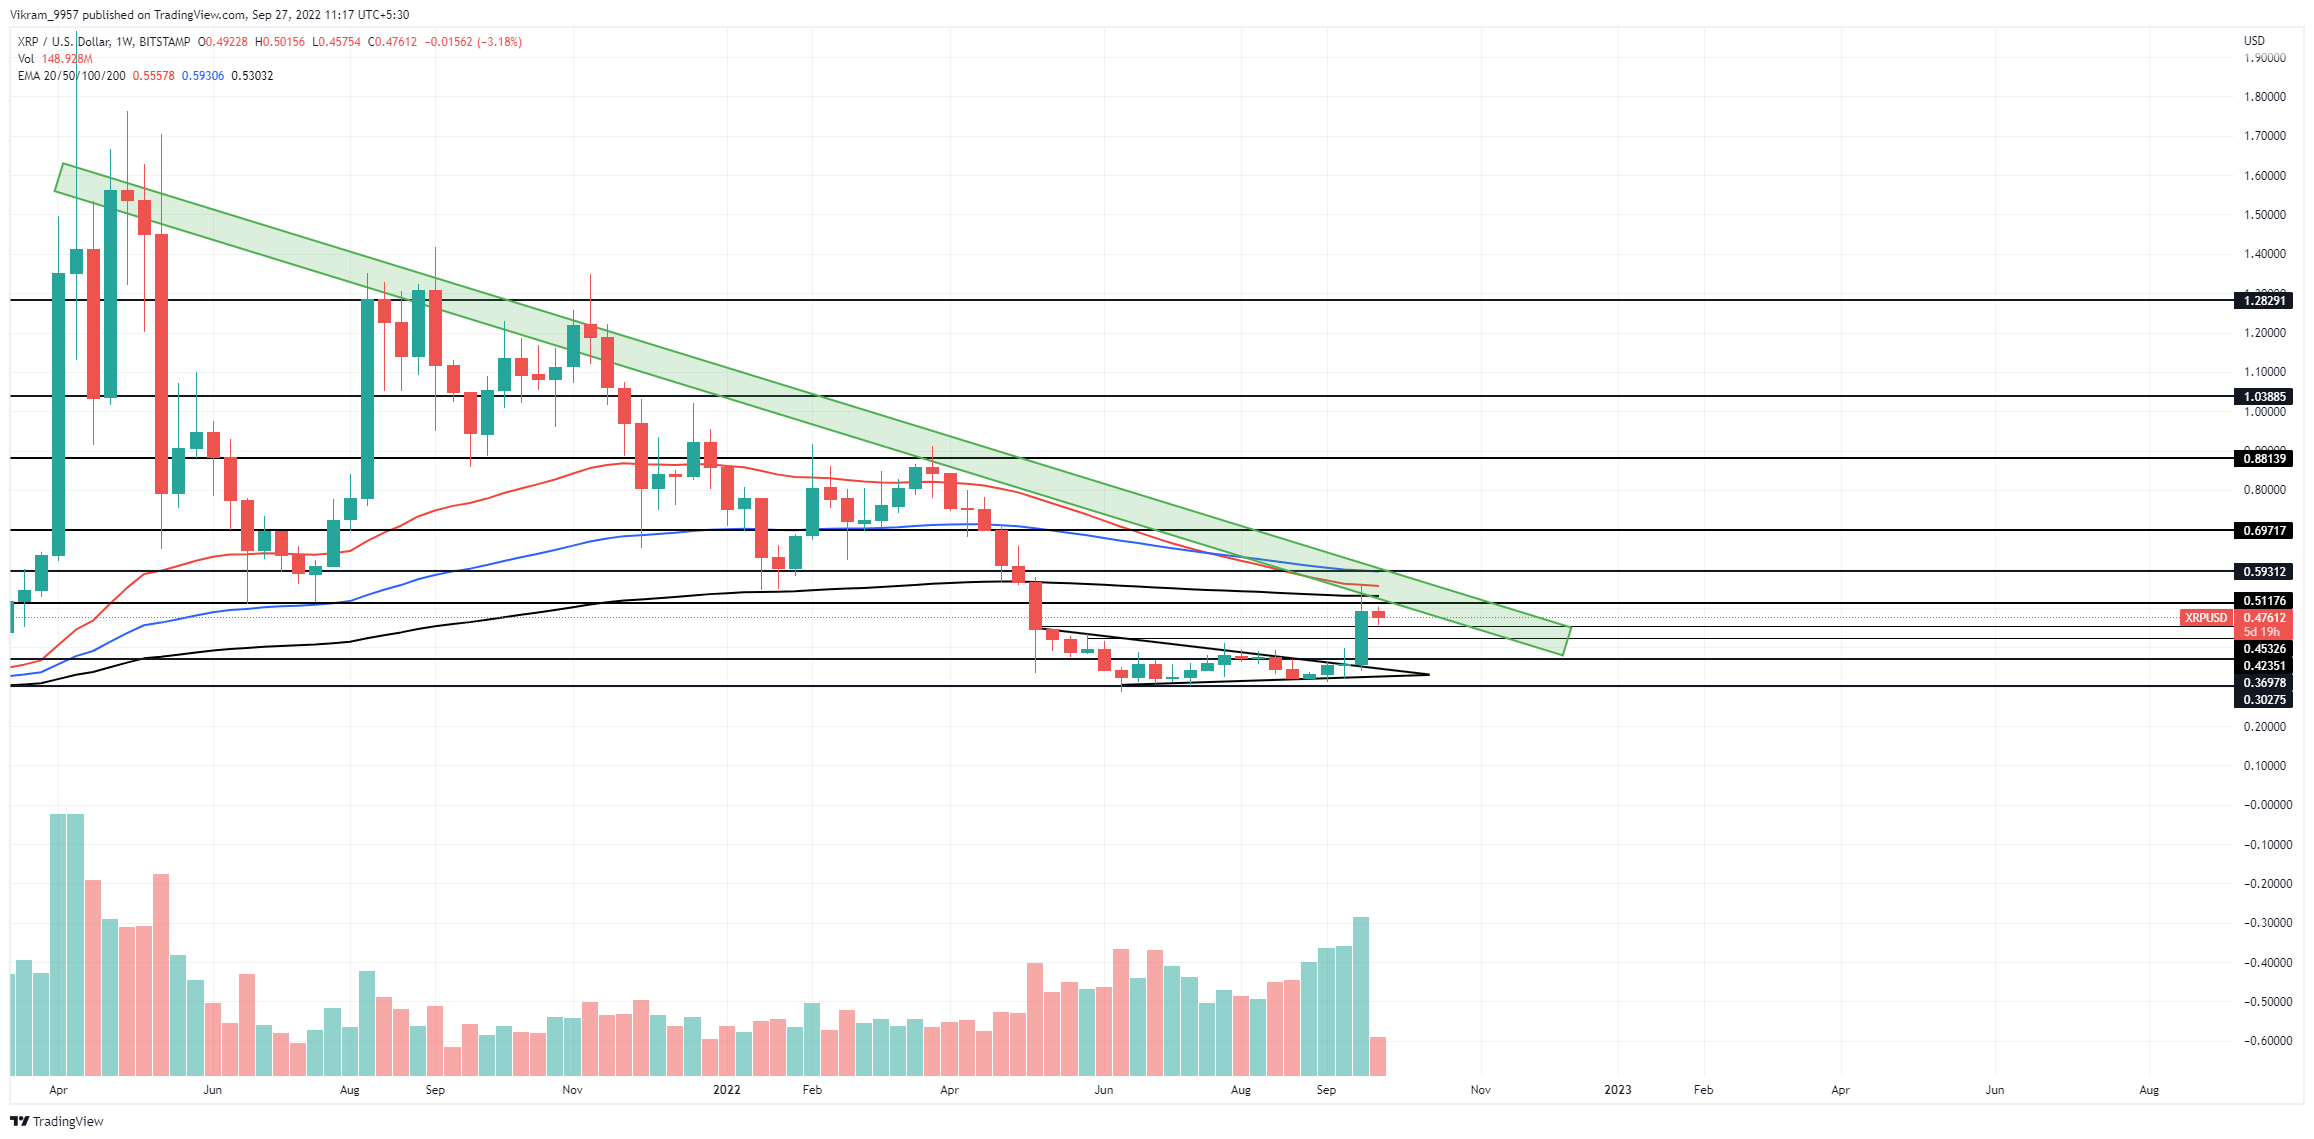 Source - TradingView Coming to the weekly chart, the bullish reversal in XRP comes with a double bottom pattern and challenges the 200-week EMA. However, the bullish rally faces opposition from the declining supply zone acting as the overhead resistance. Therefore, if the uptrend sustains to close above the $0.50 mark, sideline traders can expect another breakout entry opportunity. The traders can also find buying opportunities at the current prices as the price action highlights a hope of post-retest reversal. The upcoming resistance levels for the ongoing bull run after the $0.50 mark at $0.60 and $0.69. Short-term traders can find these levels lucrative to book profits. Conversely, if the bear wins in the power struggle, the XRP price will rain down to the bottom support at $0.30.
Technical Indicators
The remarkable increase in the underlying bullishness is evident in the RSI indicator as its slope enters the overbought boundary. Moreover, the increasing gap between the MACD and single lines fuelled by the rise of bullish histograms reflects an increase in buying pressure. Resistance Levels - $0.50 and $0.69 Support Levels - $0.40 and $0.30