- Quant price has been trading below the rising parallel channel over the daily price chart.
- QNT crypto has recovered above 20, 50, 100 and 200-days Daily Moving Average.
- The pair of QNT/BTC is at 0.006068 BTC with an intraday drop of 1.11%.
On the daily price chart, the Quant price is rising swiftly through a parallel upward channel. The token first drifted below a line that sloped downward, but was able to break free of the pattern and enter the channel that sloped upward. Token must maintain its upward movement at this pace in order to surpass the daily chart. Investors in QNT must wait until the token gains acceptance and encounters resistance that is manageable. The QNT currency is currently trading halfway between the ascending parallel channel’s upper and lower trendlines. The token needs to gain the necessary upward momentum from QNT bulls to go closer to the top trendline.
The market value of Quant Price, which was trading at $116.23 the day prior, dropped by 1.06%. The volume of trades increased by 43.40% during intraday trading. This demonstrates how QNT is currently able to keep up the momentum with the assistance of the bulls. Volume to market cap ratio is 0.04456.
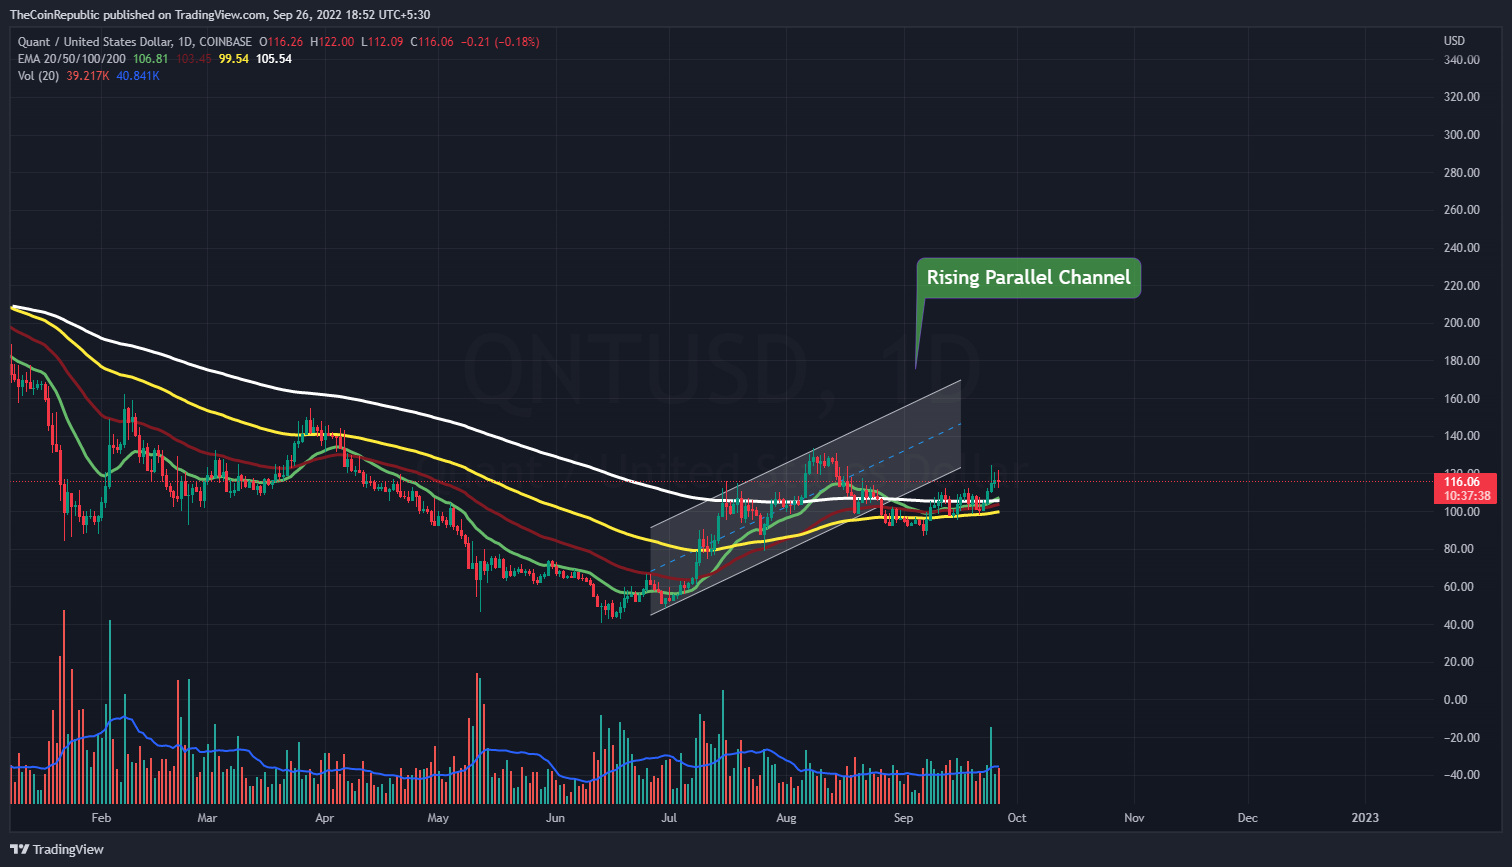
The price of the QNT coin varies inside a rising parallel channel on the daily chart. Since the coin is currently flowing upstream in that direction, QNT bulls must maintain their proximity to the trendline. The under-average QNT coin volume change must increase in order to lessen the volatility that bears cause throughout the intraday trading session. The price of the QNT coin must continue to rise following its breakthrough.
What do Technical Indicators suggest about Quant?
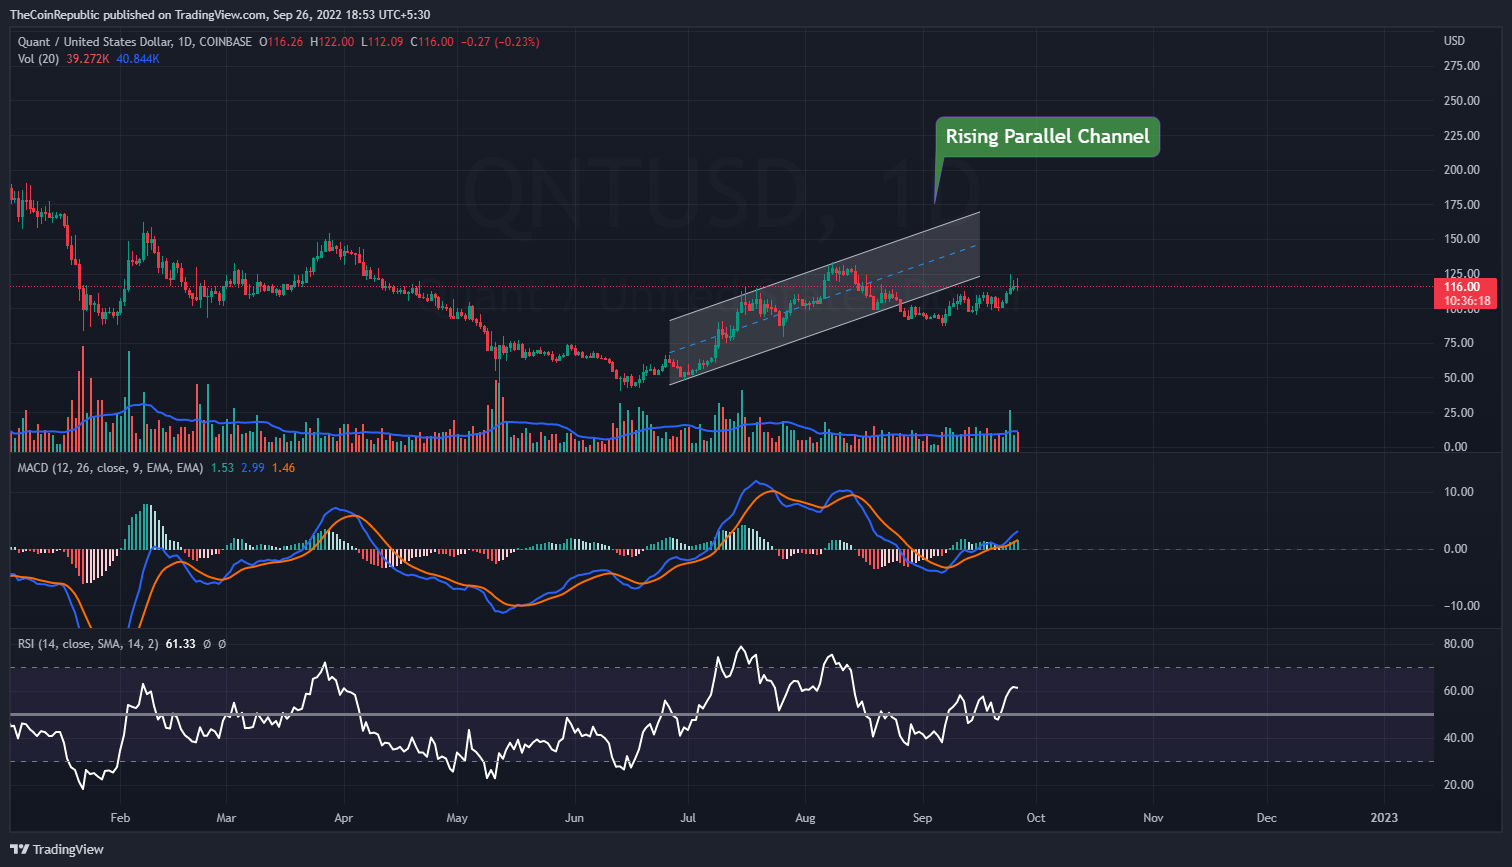
Over the course of the daily price chart, the price of the QNT coin has been varying inside a rising parallel channel. To exit the rising pattern, the token needs to move in the direction of the top trendline. According to technical indicators, the QNT coin is strongly uptrending in the direction of the ascending parallel channel.
The momentum of the upswing for the QNT coin is displayed by the Relative Strength Index. Currently trading over neutrality, the RSI is approaching overbought territory. The MACD shows a bullish momentum for the QNT currency. The MACD line is in front of the signal line after a positive crossover. Investors in QNT should monitor the daily chart for any potential changes in trends.
Conclusion
On the daily price chart, the Quant price is rising swiftly through a parallel upward channel. The token first drifted below a line that sloped downward, but was able to break free of the pattern and enter the channel that sloped upward. Token must maintain its upward movement at this pace in order to surpass the daily chart. Investors in QNT must wait until the token gains acceptance and encounters resistance that is manageable. The under-average QNT coin volume change must increase in order to lessen the volatility that bears cause throughout the intraday trading session. The price of the QNT coin must continue to rise following its breakthrough.
Technical Levels
Support Levels: $110.00 and $100.00
Resistance Levels: $120.00 and $125.00
Disclaimer
The views and opinions stated by the author, or any people named in this article, are for informational ideas only, and they do not establish the financial, investment, or other advice. Investing in or trading crypto assets comes with a risk of financial loss.