Be[in]Crypto takes a look at the five cryptocurrencies that decreased the most last week, more specifically, from Sept. 16 to Sept. 23.
These cryptocurrencies are:
- Ravencoin (RVN): -24.54%
- Ethereum Classic (ETC): -17.12%
- The Open Network Toncoin (TON): -15.19%
- EOS: -14.41%
- Curve DAO Token (CRV): -13.05%
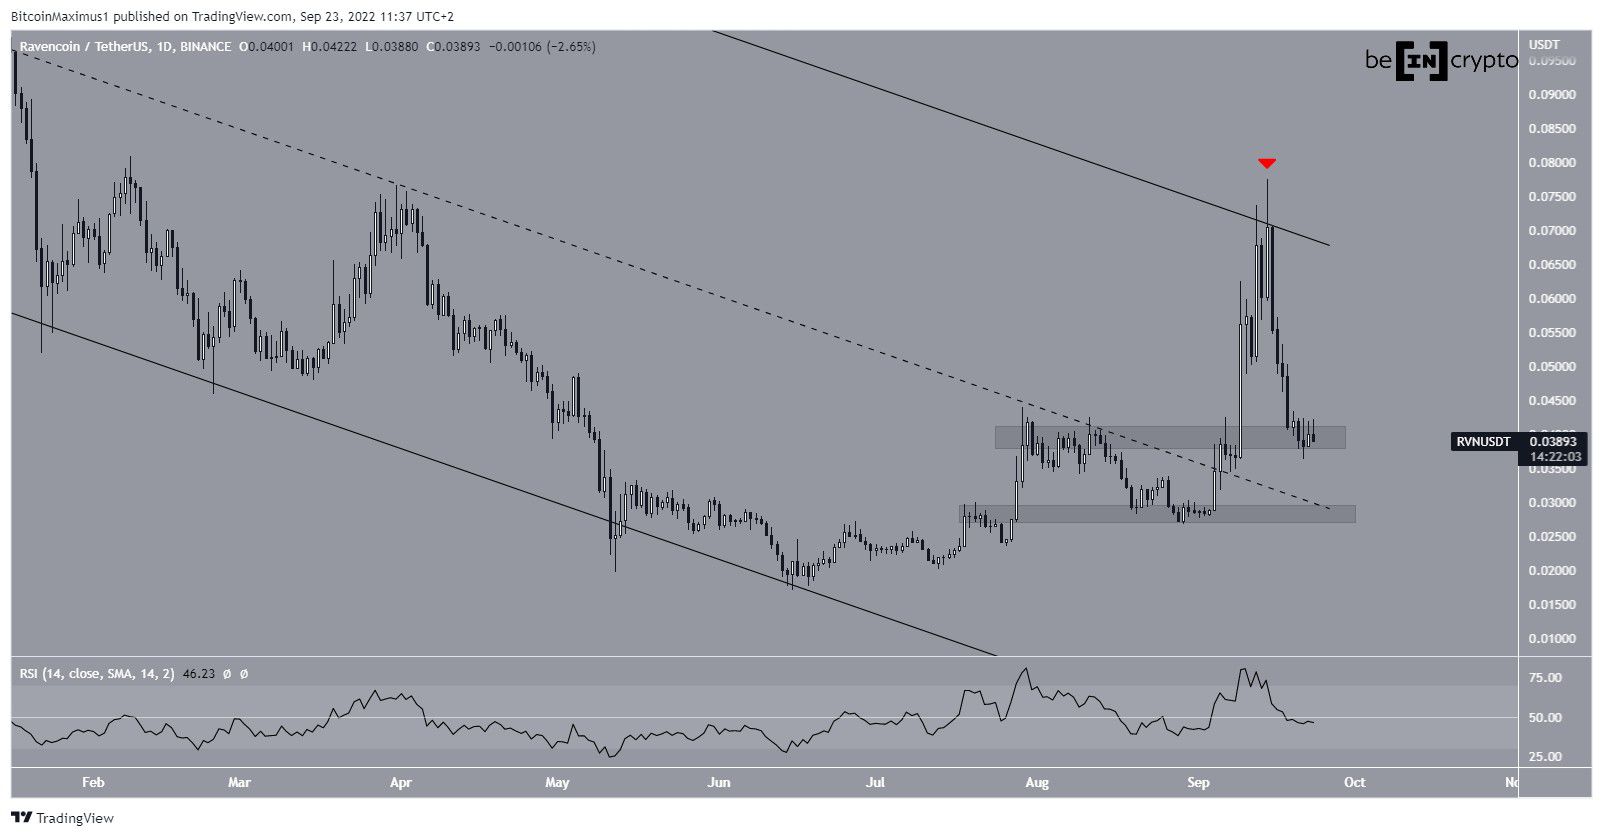
RVN price may fall to next support level
RVN has been falling since it was rejected by the resistance line of a long-term descending parallel channel on Sept. 14 (red icon). The downward movement has so far led to a low of $0.036, which was reached on Sept. 21.
The low was made inside the $0.04 horizontal support area. Additionally, the daily RSI has just fallen below 50.
If RVN fails to hold on above this area, it could decrease towards the next support at $0.027.
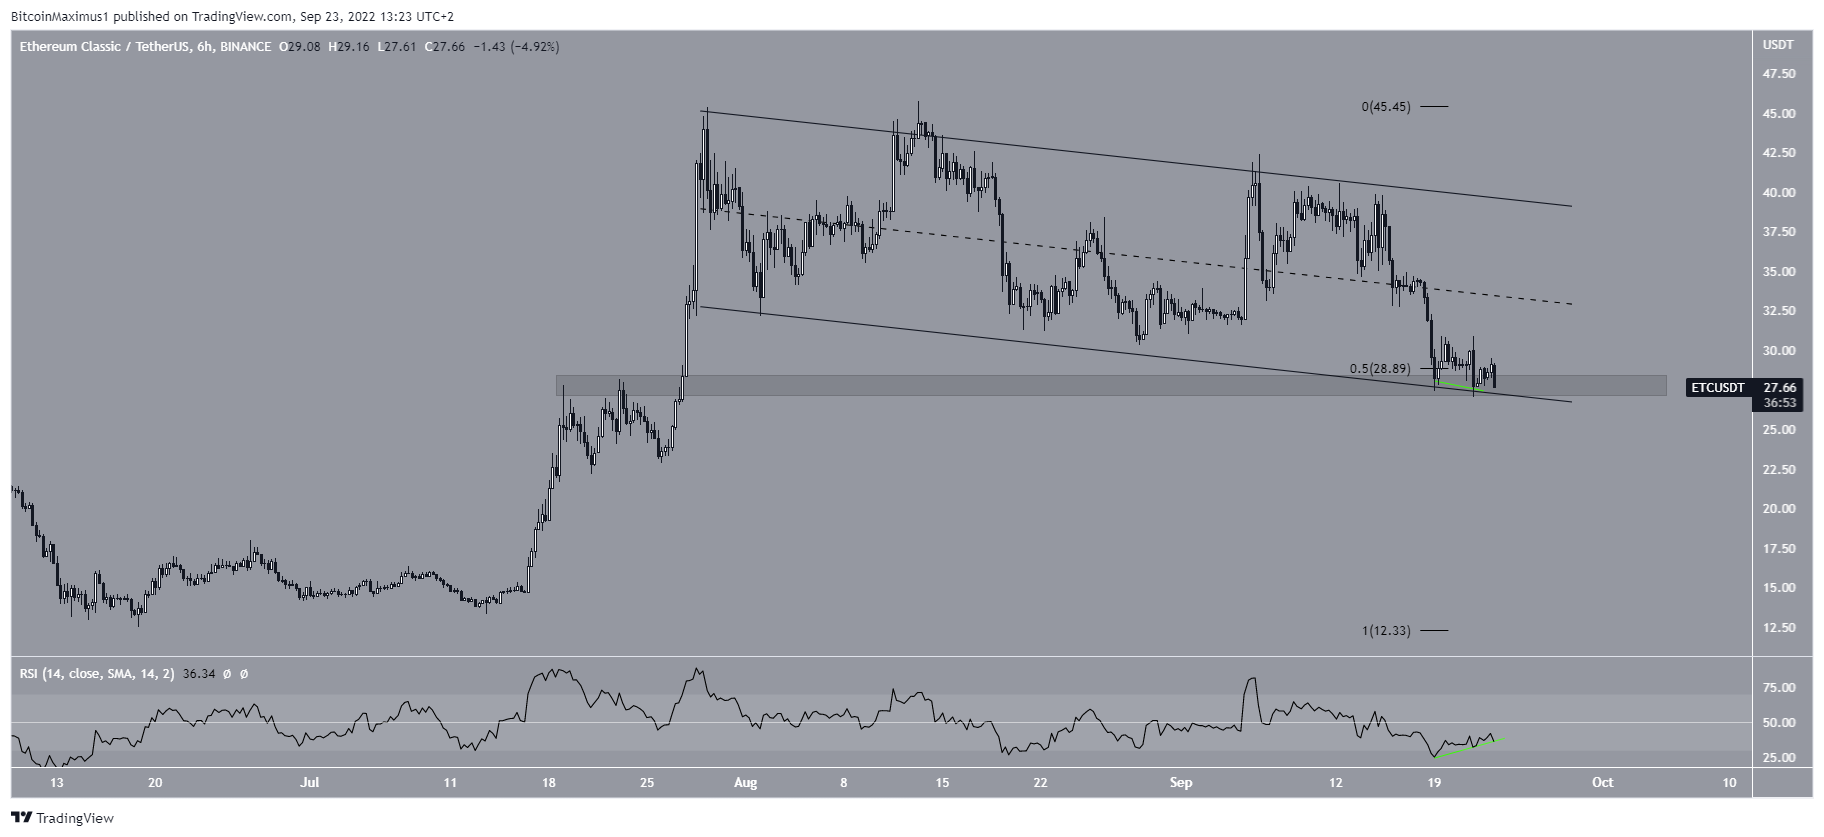
ETC price: Breakout soon?
ETC has been falling inside a descending parallel channel since July 19, when it reached a high of $45.36. Currently, ETC is trading very close to the support line of the channel.
The price bounced twice at the support line of the channel on Sept. 19 and 21, creating a possible double bottom pattern.
The pattern was combined with bullish divergence in the RSI and was made at a confluence of support levels between $27-$28. The support is created by the 0.5 Fib retracement support level and a horizontal support area.
So, a bounce at this level and a reclaim of the middle of the channel seems likely. If this occurs, it would suggest that an eventual breakout is likely.
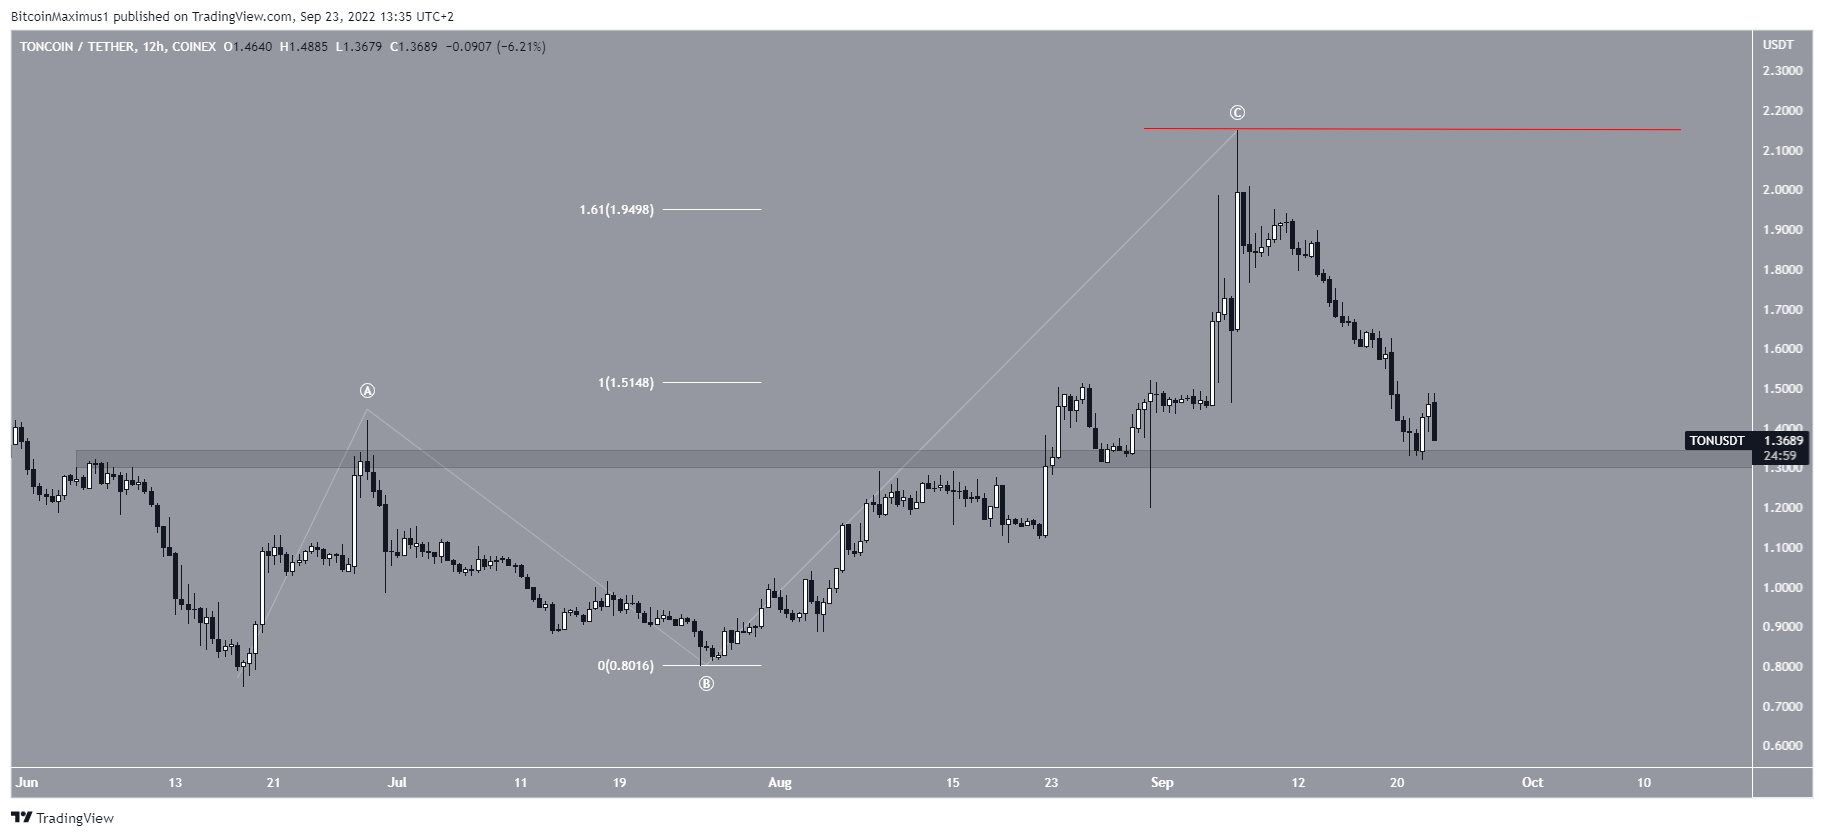
TON price direction uncertain
TON has been moving upwards since reaching a low of $0.74 on June 18. The increase led to a high of $2.15 on Sept. 7.
However, the price has been decreasing since. Therefore, the entire preceding increase now looks like an A-B-C corrective structure, in which waves A:C had a 1:1.61 ratio (white)
If correct, it would mean that the price will now fall to new lows. Nevertheless, a bounce at the $1.33 horizontal support area could occur.
An increase above the wave C high of $2.15 would invalidate this particular wave count.
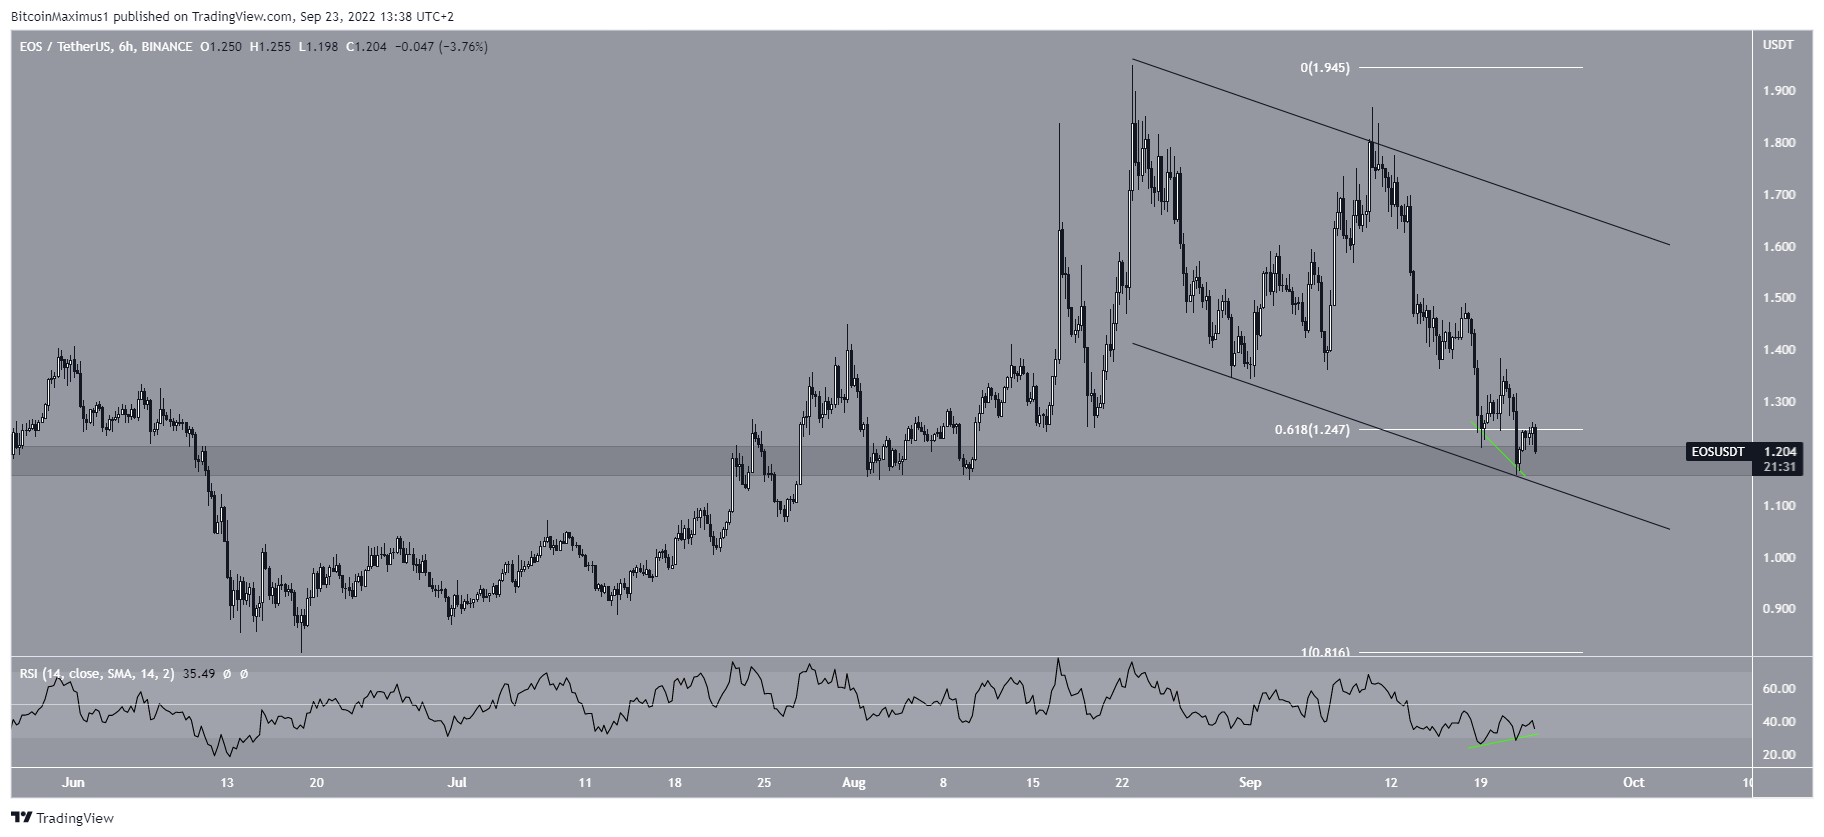
EOS price may bounce
The movement of EOS is very similar to that of ETC. The price has been decreasing inside a descending parallel channel since reaching a high of $1.95 on Aug. 22.
Currently, EOS is trading very close to the support line of the channel and inside the $1.20 horizontal support area. Additionally, the six-hour RSI has generated bullish divergence.
Therefore, it is possible that a significant bounce will follow.
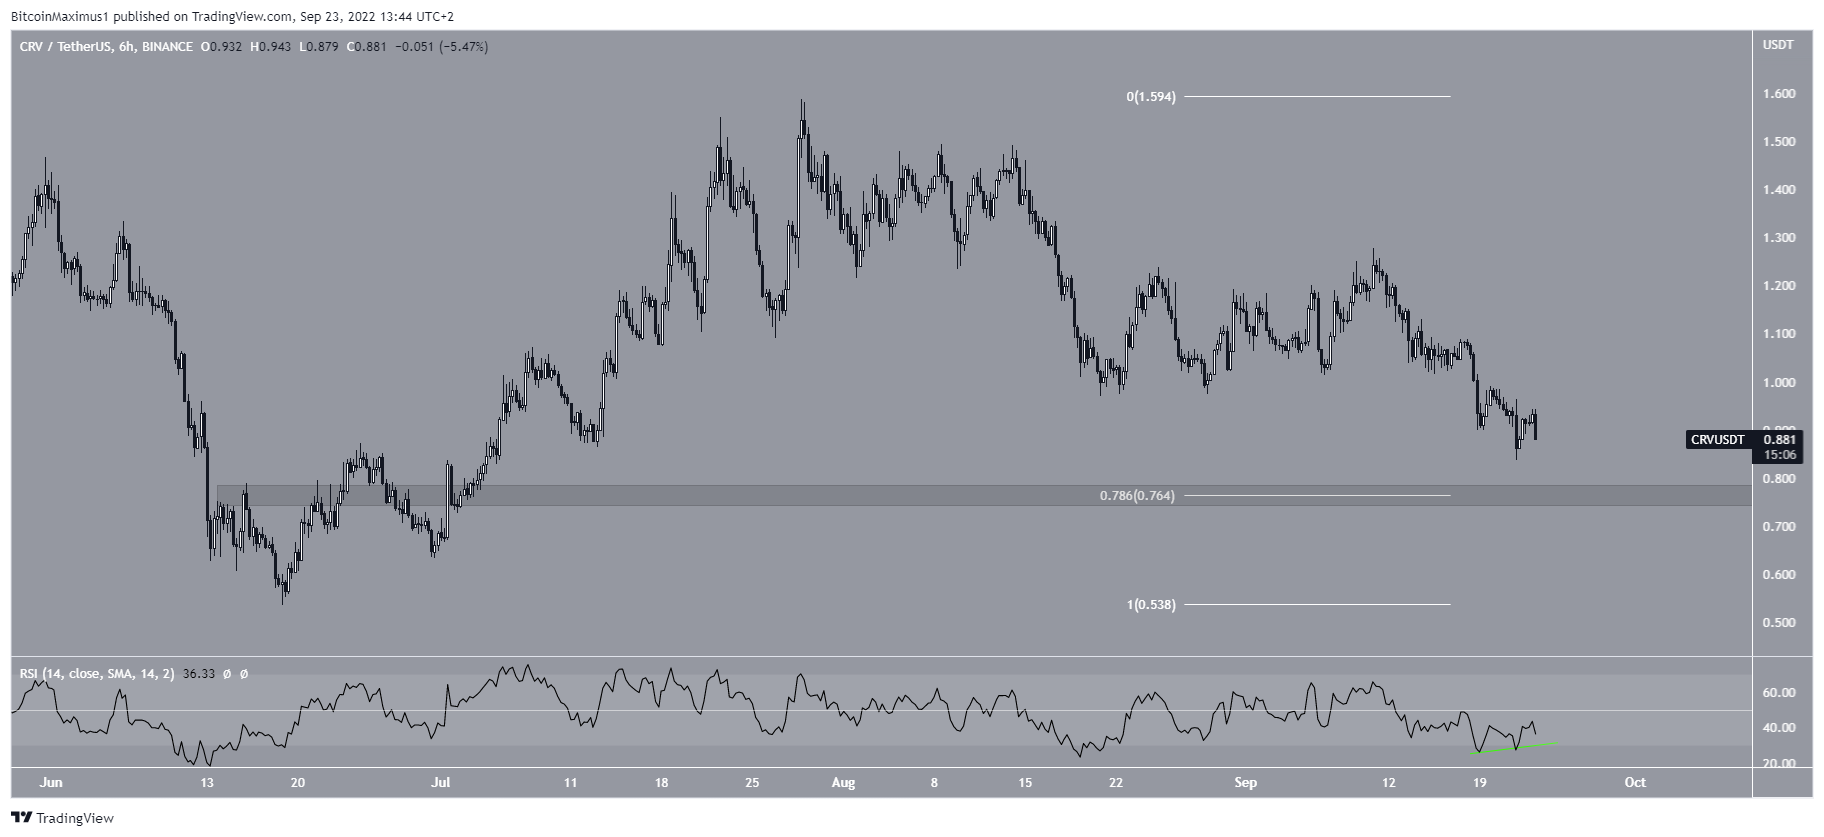
CRV price set for big leap
CRV has been decreasing since reaching a high of $1.58 on July 28. The downward movement has so far led to a low of $0.83. The low was made slightly above the $0.76 support area.
While there are no decisive bullish signs in place, the six-hour RSI has begun to generate bullish divergence, so it is possible that a substantial bounce will follow once CRC reaches the $0.76 support area.
For Be[In]Crypto’s latest Bitcoin (BTC) analysis, click here