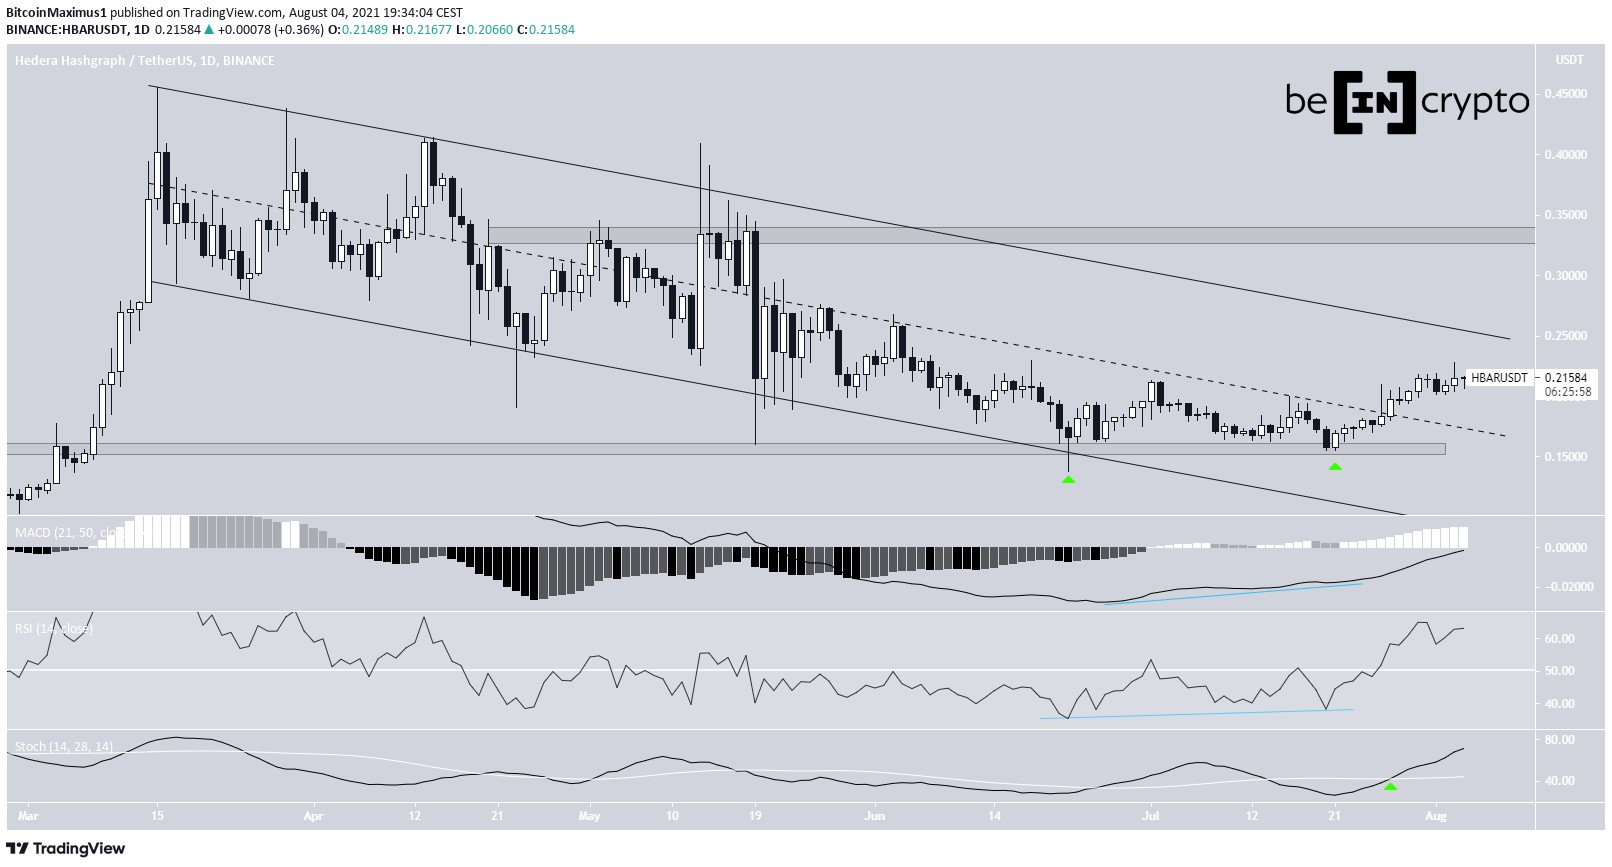
Hedera Hashgraph (HBAR) has reclaimed the middle of a descending parallel channel after bouncing at the $0.155 horizontal support area.
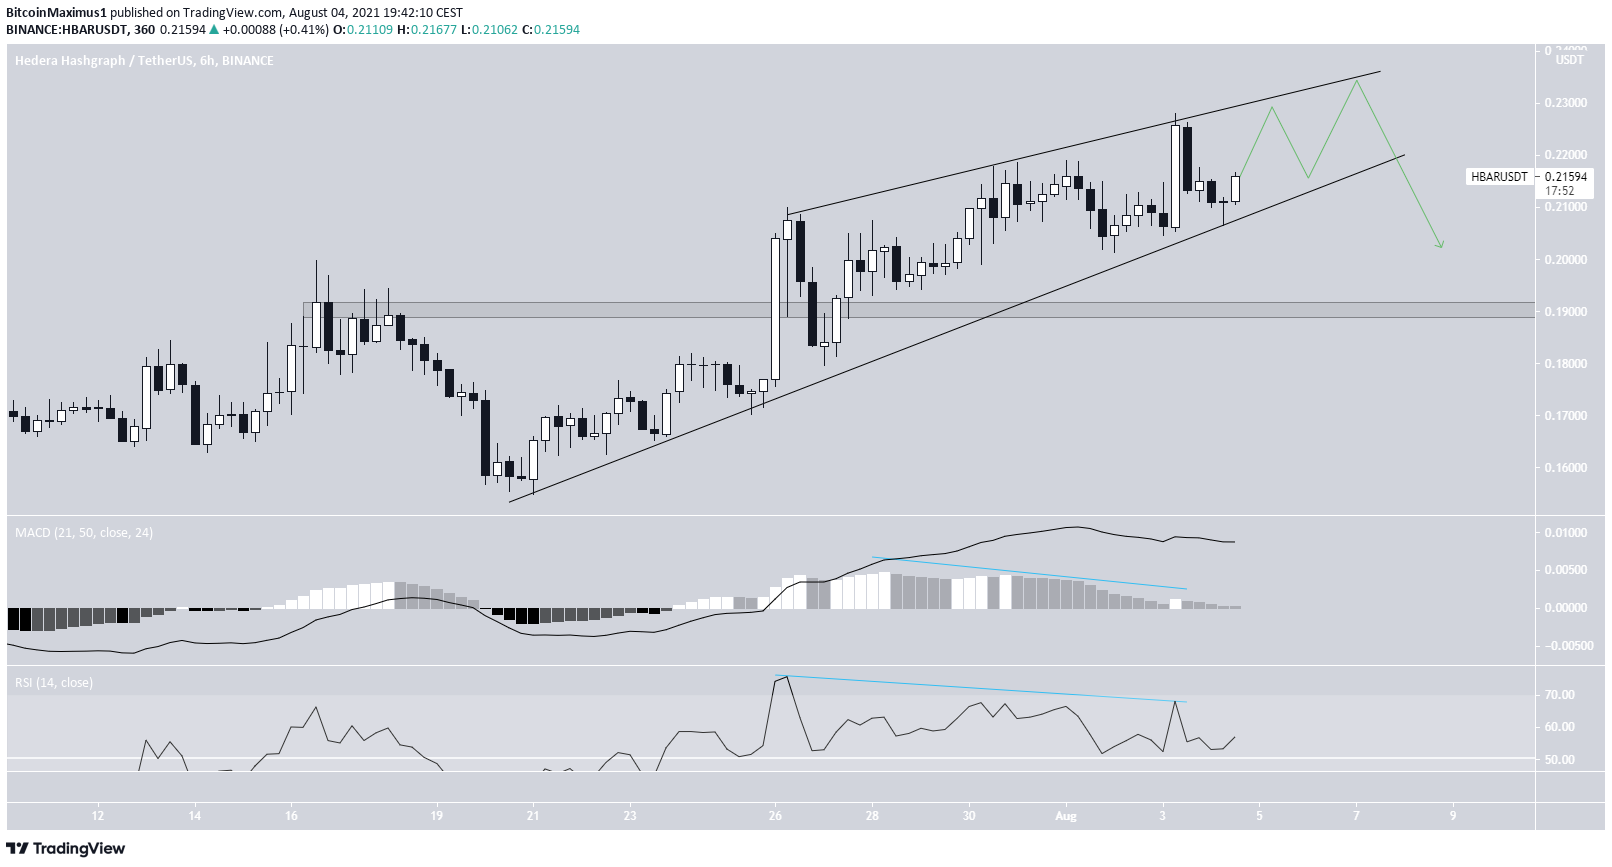
The daily time-frame provides a bullish reading, HBAR is trading inside a short-term bearish pattern, from which a breakdown would be likely.
HBAR reclaims channel
HBAR has been decreasing inside a descending parallel channel since reaching an all-time high price of $0.455 on March 15. Such channels often contain corrective structures. Furthermore, the decrease inside it has been extremely gradual and has had significant overlap.
On June 22, HBAR reached the support line of the channel and the $0.155 horizontal support area. It bounced immediately, creating a long lower wick (green icon). It returned to this same level on July 21, successfully completing a double bottom pattern. The pattern was also combined with bullish divergence in the MACD & RSI. In addition to this, the Stochastic oscillator has made a bullish cross.
HBAR has been increasing since, and is currently approaching the resistance line of the channel at $0.25. If a breakout from the channel were to occur, the main resistance area would be at $0.335.

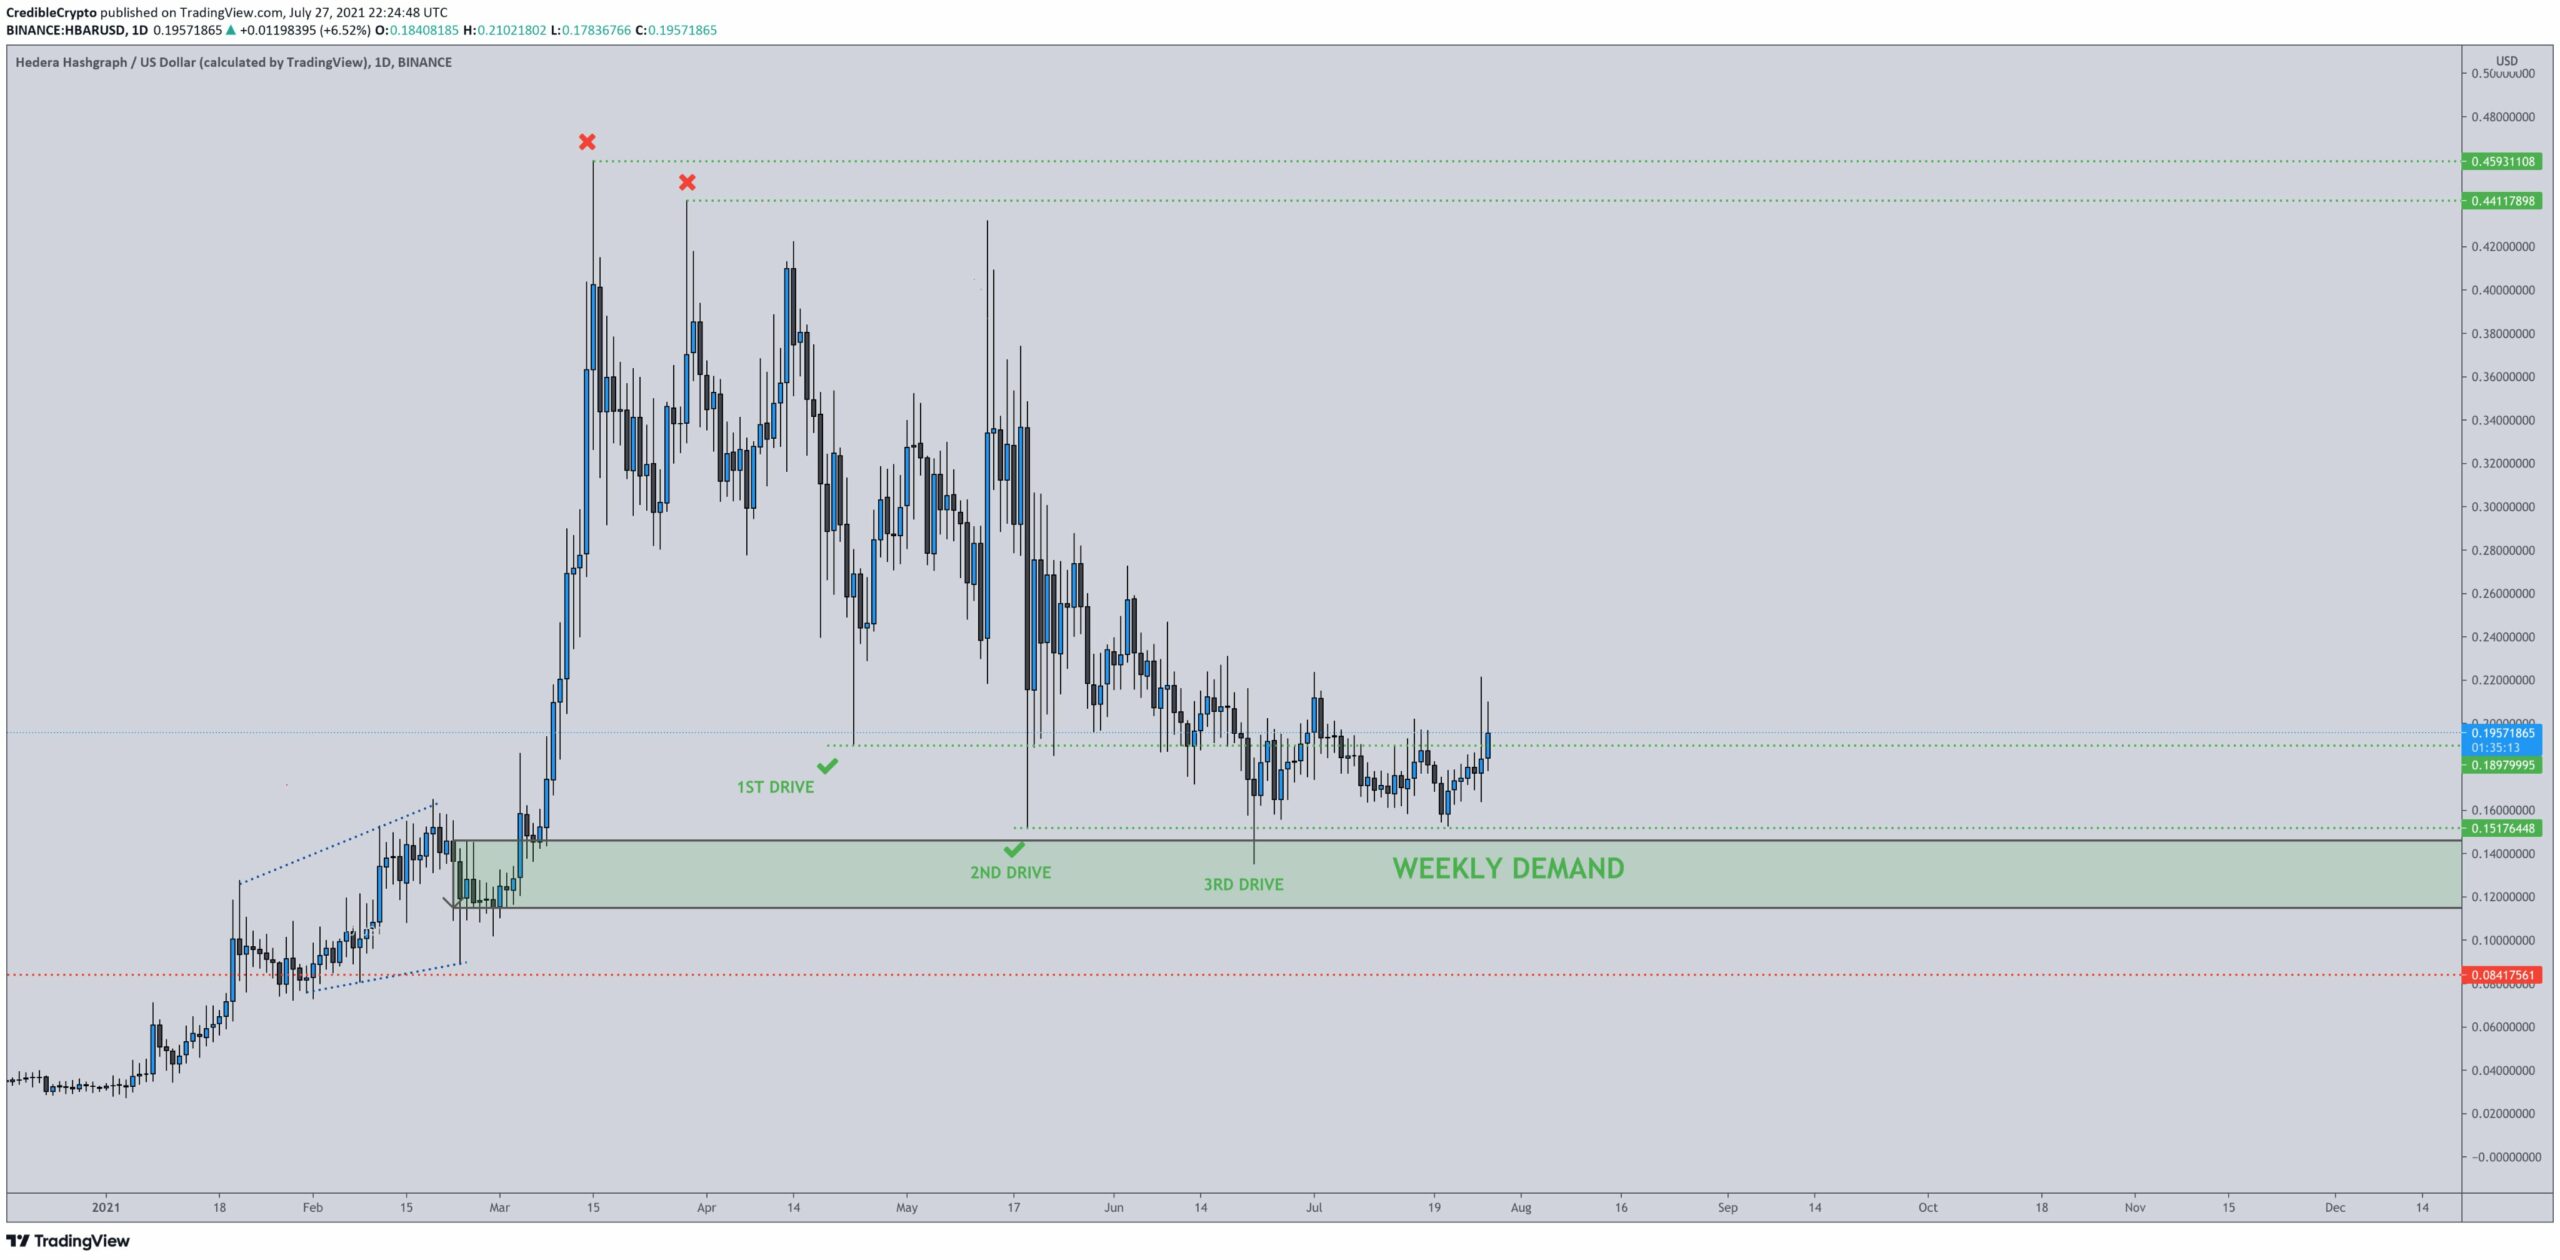
Cryptocurrency trader @CredibleCrypto outlined an HBAR chart, stating that after three failed breakdown attempts, the token is accumulating just above long-term support. As shown above, it has bounced since the tweet and reclaimed the middle of the channel.

Future movement
The shorter-term six-hour chart is not as bullish as its daily counterpart. HBAR seems to be trading inside an ascending wedge, which is considered a bearish pattern. In addition to this, the pattern has been combined with bearish divergences in both the RSI and MACD.
If a breakdown occurs, the main support would be at $0.19. This would also coincide with the middle of the long-term channel outlined in the previous section.
Afterwards, it could potentially make another attempt at moving towards the resistance line of the long-term channel.

 beincrypto.com