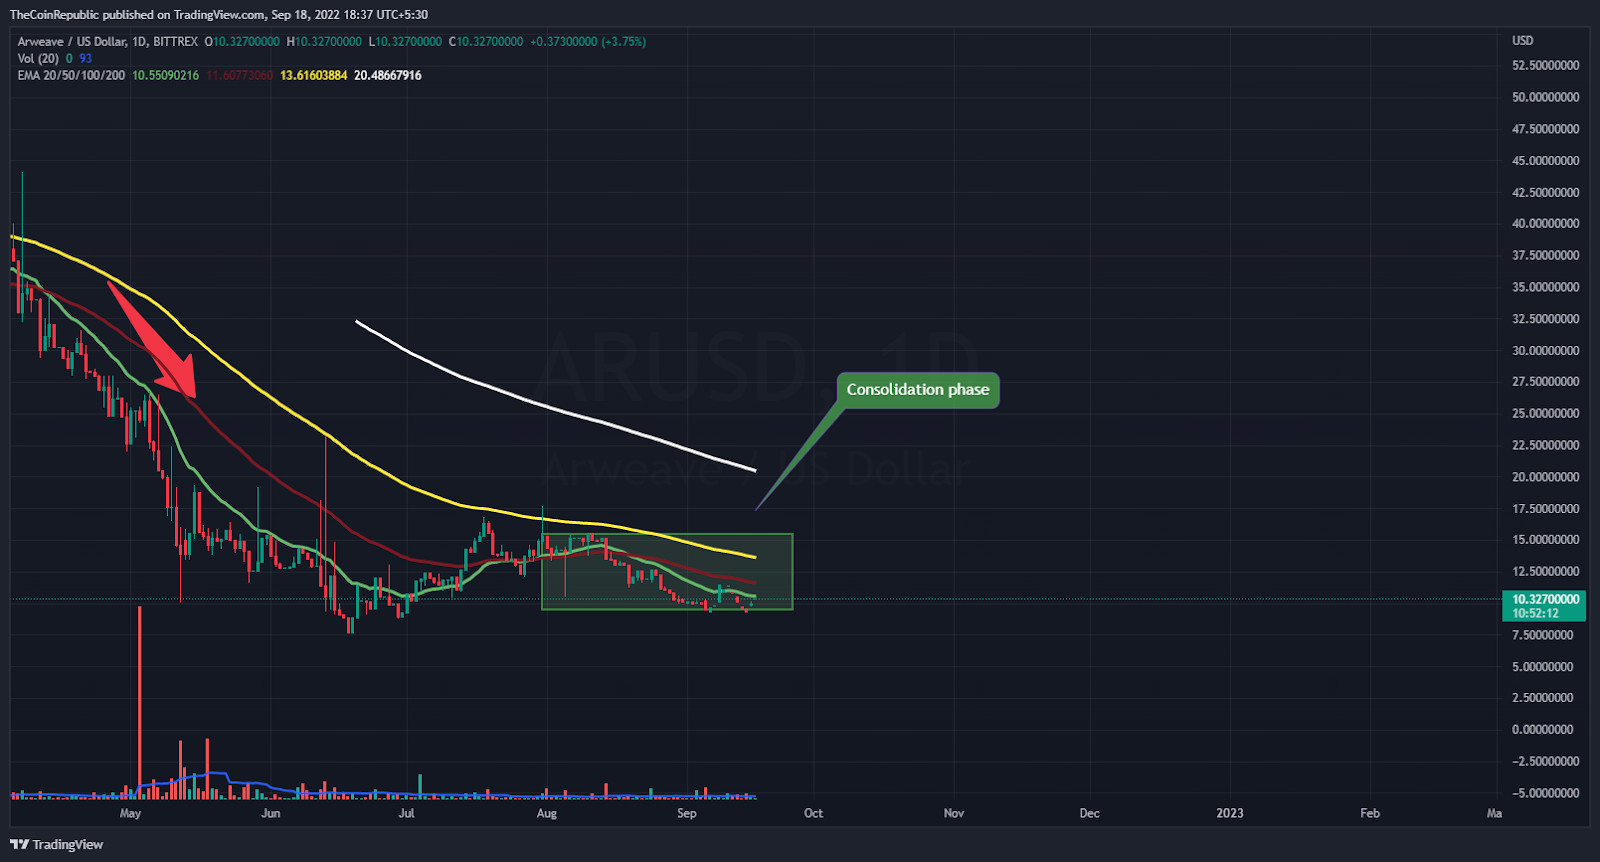
- Arweave price is trying to surge towards the upper price range of the consolidation phase over the daily price chart.
- AR crypto is trading below 20, 50, 100, and 200-day Daily Moving Average.
- The pair of AR/BTC is at 0.0005051 BTC with an intraday gain of 0.40%.
The daily pricing chart clearly demonstrates the rising cost of Arweave. On April 7, the price of the token started to decline and reached $43 that day. Even if it is now trading toward the higher trendline, the currency is unmistakably going upward and committed to breaking out of the consolidation. Investors in AR cannot buy until bulls hold control of the region’s outside border, which is indicated by a horizontal range. The AR coin’s price seems to be very committed to breaking out of the consolidation phase. The customer base of AR must grow if it is to follow the consolidation phase’s top trendline. The price of the currency in AR has always ranged from $9.60 to $15.50.
The current estimated price for Arweave is $10.32, and yesterday’s market value increased by 0.97%. The volume of transactions decreased by 16.66% during intraday trading. This demonstrates that short sellers are exerting pressure on the daily chart of the AR currency. The volume to market cap ratio is 0.03443.
The price of the AR currency is aiming to continue the upward trend apparent throughout the daily price chart in addition to trying to increase demand. For AR to move upward and grow closer to the top trendline of the consolidation phase, the token must maintain its current level. To record its recovery phase, the token must exit the consolidation phase. The volume shift needs to be raised in favor of the bulls, as it is currently below normal.
What do Technical Indicators suggest about AR?
The price of the AR currency is now trying to stay steady. As long as buyers participate in the transaction, the AR currency may exit the consolidation period. Bears, however, could halt the current bullish climb of the AR currency by pulling the token back near the lower trendline. Technical indicators show that the AR currency is inclining.
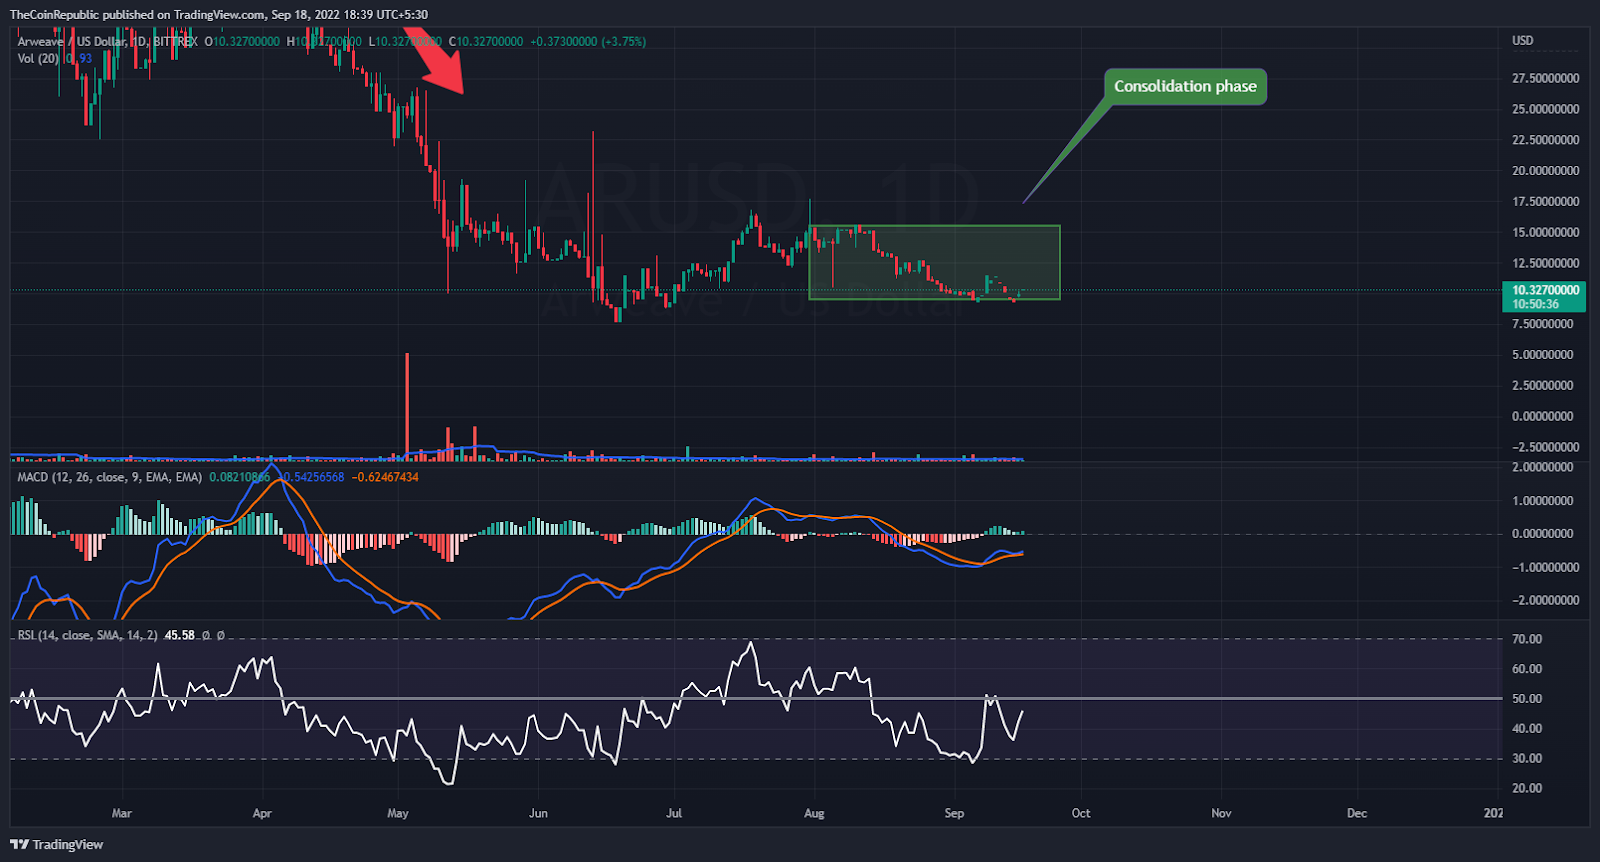
The relative strength indicator shows the AR coin’s uptrend momentum. The RSI is just starting to leave neutrality at 45. The MACD indicates that the momentum for the AR currency is favorable. In the wake of a positive crossover, the MACD line is higher than the signal line. AR investors must monitor the daily chart for any shifts in trends.
Conclusion
The daily pricing chart clearly demonstrates the rising cost of Arweave. On April 7, the price of the token started to decline and reached $43 that day. Even if it is now trading toward the higher trendline, the currency is unmistakably going upward and committed to breaking out of the consolidation. Investors in AR cannot buy until bulls hold control of the region’s outside border, which is indicated by a horizontal range. The AR coin’s price seems to be very committed to breaking out of the consolidation phase. The volume shift needs to be raised in favor of the bulls, as it is currently below normal. Technical indicators show that the AR currency is inclining.
Technical Levels
Support Levels: $9.50 and $8.95
Resistance Levels: $11.00 and $12.00
Disclaimer
The views and opinions stated by the author, or any people named in this article, are for informational ideas only, and they do not establish any financial, investment, or other advice. Investing in or trading crypto assets comes with a risk of financial loss.