The announcement that the Ripple vs SEC case would soon be settled led to a significant XRP price boost over the last few days. The below chart shows the highest volume traded in XRP since June 30 as a result of buying pressure.
Technical Analysis
By Grizzly
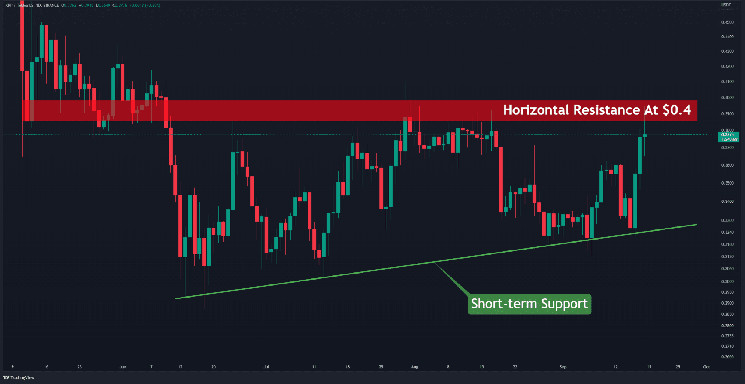
The Daily Chart
After bottoming out in June at roughly $0.28, the price of XRP surged by more than 30%. This mini-rally resulted in another attempt to break the key horizontal resistance at $0.4 (in red). However, so far, the critical level had rejected those attempts.
In the previous attempt that happened in mid-August, the bears pushed the price to short-term support (in green) around $0.32. After retesting this level multiple times, making it a local bottom, Ripple bounced back for another retest of the $0.4 level. A daily close above the level will be the first sign for the next possible bullish wave.
The asset may break out from the 100-day consolidation period as a result of such a move, though, as of yet, the bears haven’t allowed this to occur. This bullish structure is valid as long as the price sustains support at $0.35.
Key Support Levels: $0.35 & $0.32
Key Resistance Levels: $0.40 & $0.50
Daily Moving Averages:
MA20: $0.34
MA50: $0.35
MA100: $0.34
MA200: $0.49
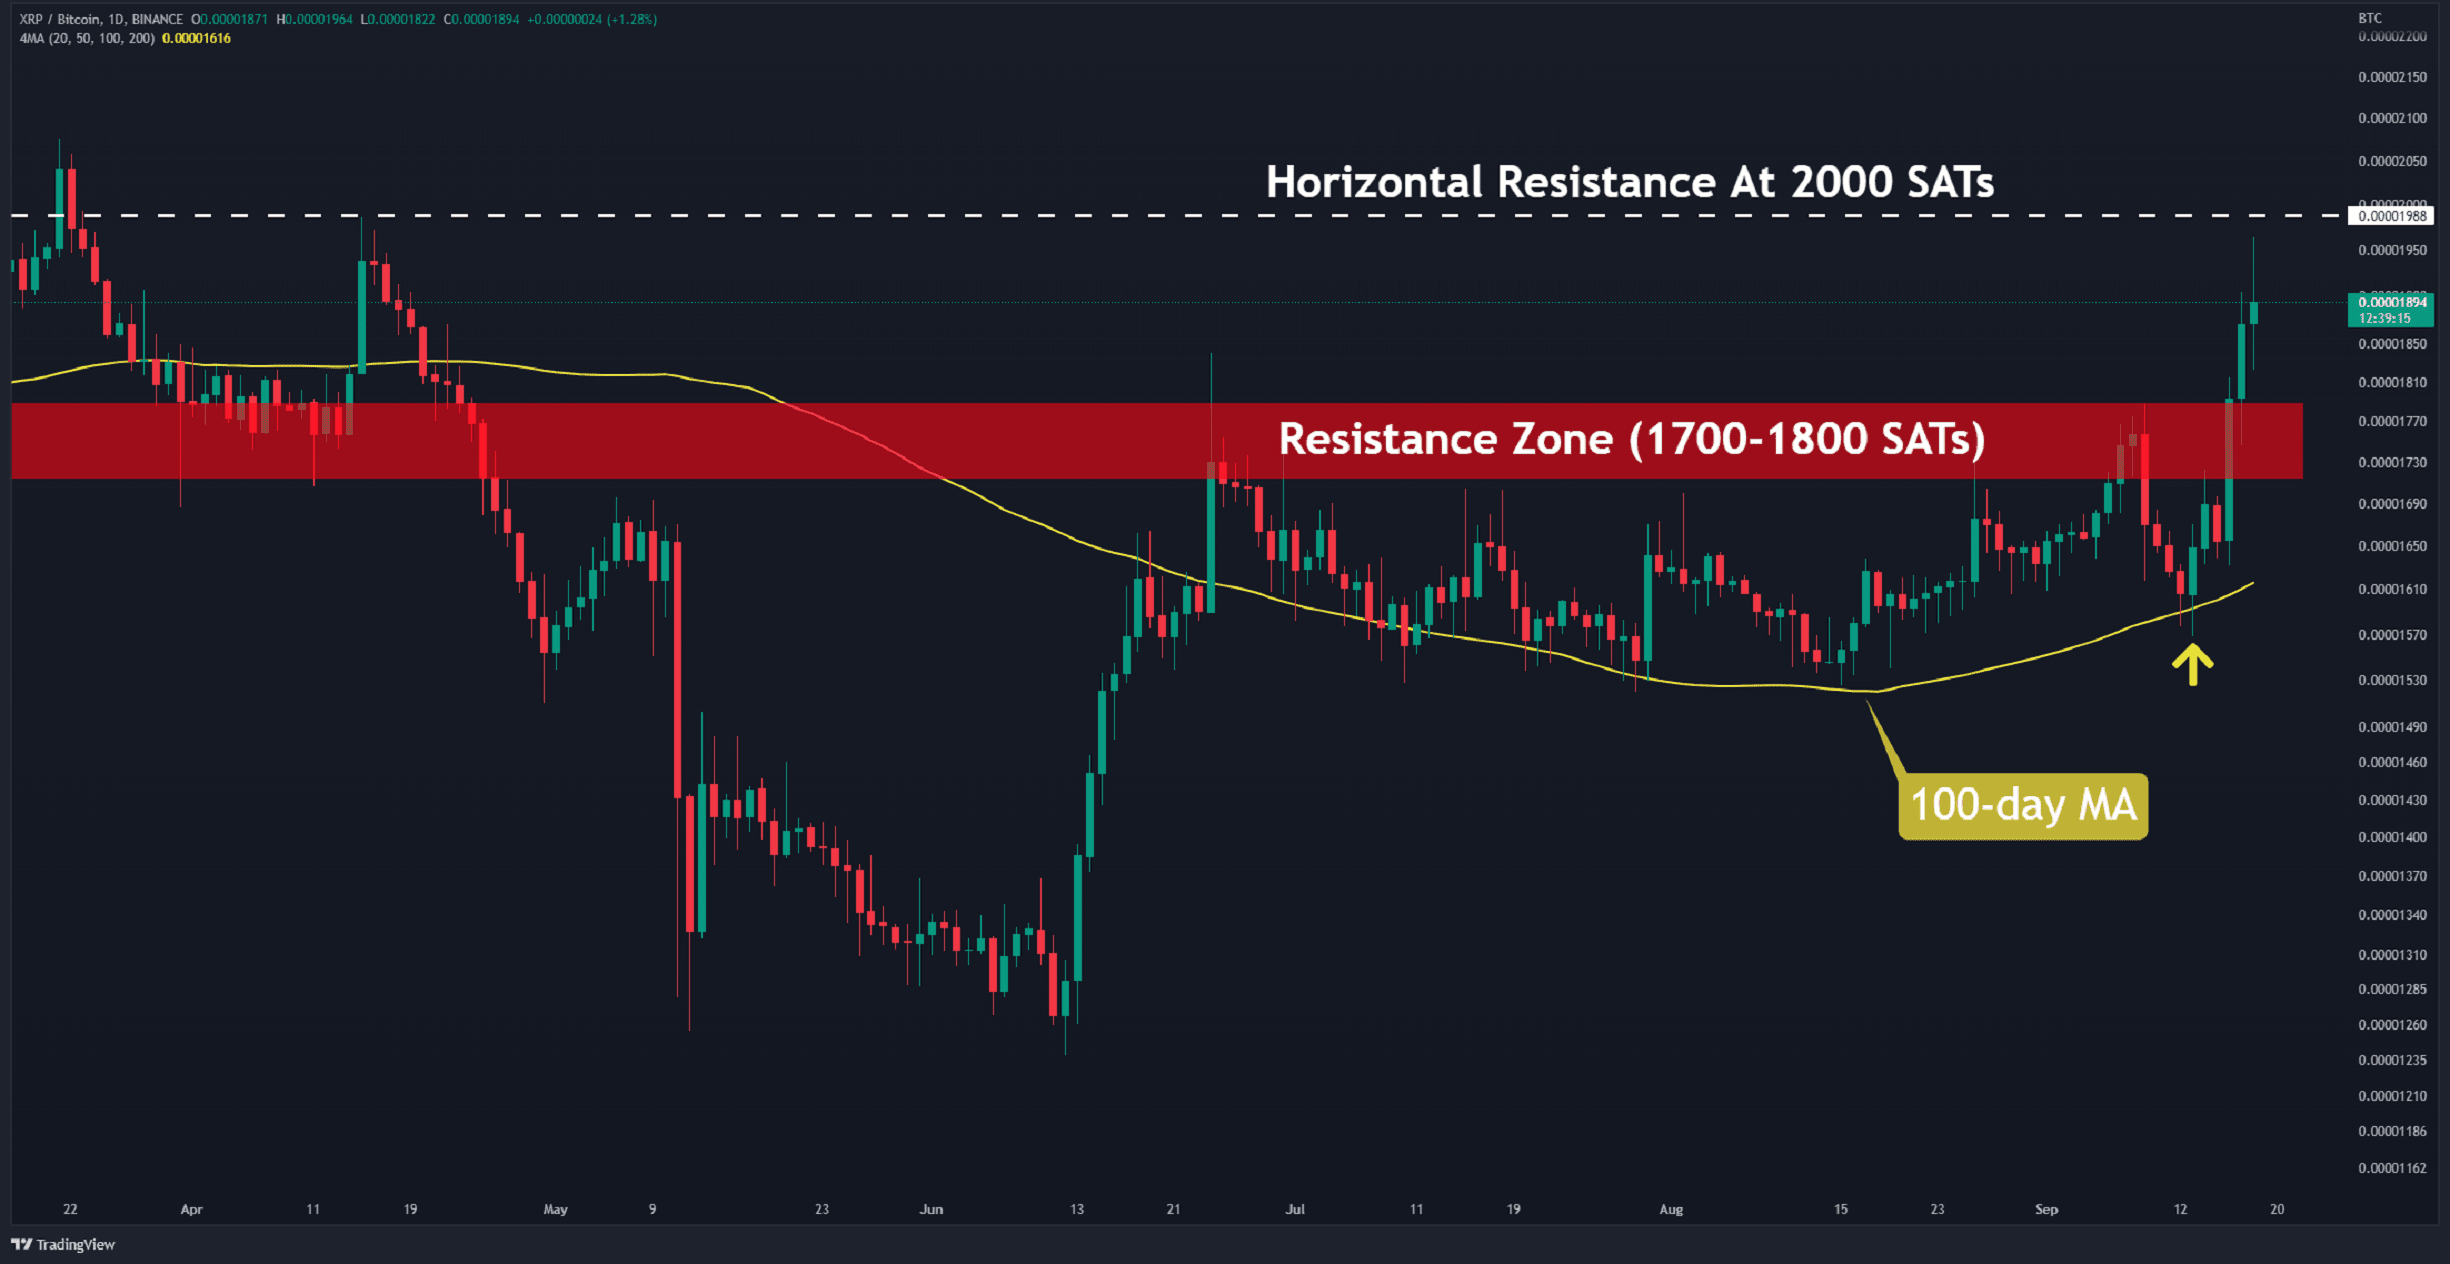
The XRP/BTC Chart
Against Bitcoin, the bulls clearly dominate the market. They have pushed the price above the barrier in the $1,700–1,800 area (in red). If the bullish sentiment continues, the next obstacle will be found at 2000 SATs (in white).
However, a retest of the 1800 SAT zone (to confirm as support) is also likely. If the buyers manage to hold the pair above the red zone, the next bullish target- 2000 SAT – becomes likely.
Key Support Levels: 1800 SATs & 1550 SATs
Key Resistance Levels: 2000 SATs & 2150 SATs