The CHZ price action shows a bullish reversal in a descending triangle teasing a breakout rally with a potential to reach the $0.25 supply zone. The CHZ price action shows a double bottom pattern forming at the $0.18 mark with a morning star pattern. The increased buying pressure and the growing bullish engulfing candle in the daily chart forecast a short-term resistance trendline breakout. So, should you wait for the candle to close above the trendline or take an early entry?
Key Points:
- The Chiliz price action shows a double bottom pattern.
- The 50-day EMA cushions the falling prices and prepares a bullish bounceback.
- The intraday trading volume in Chiliz is $437 million.
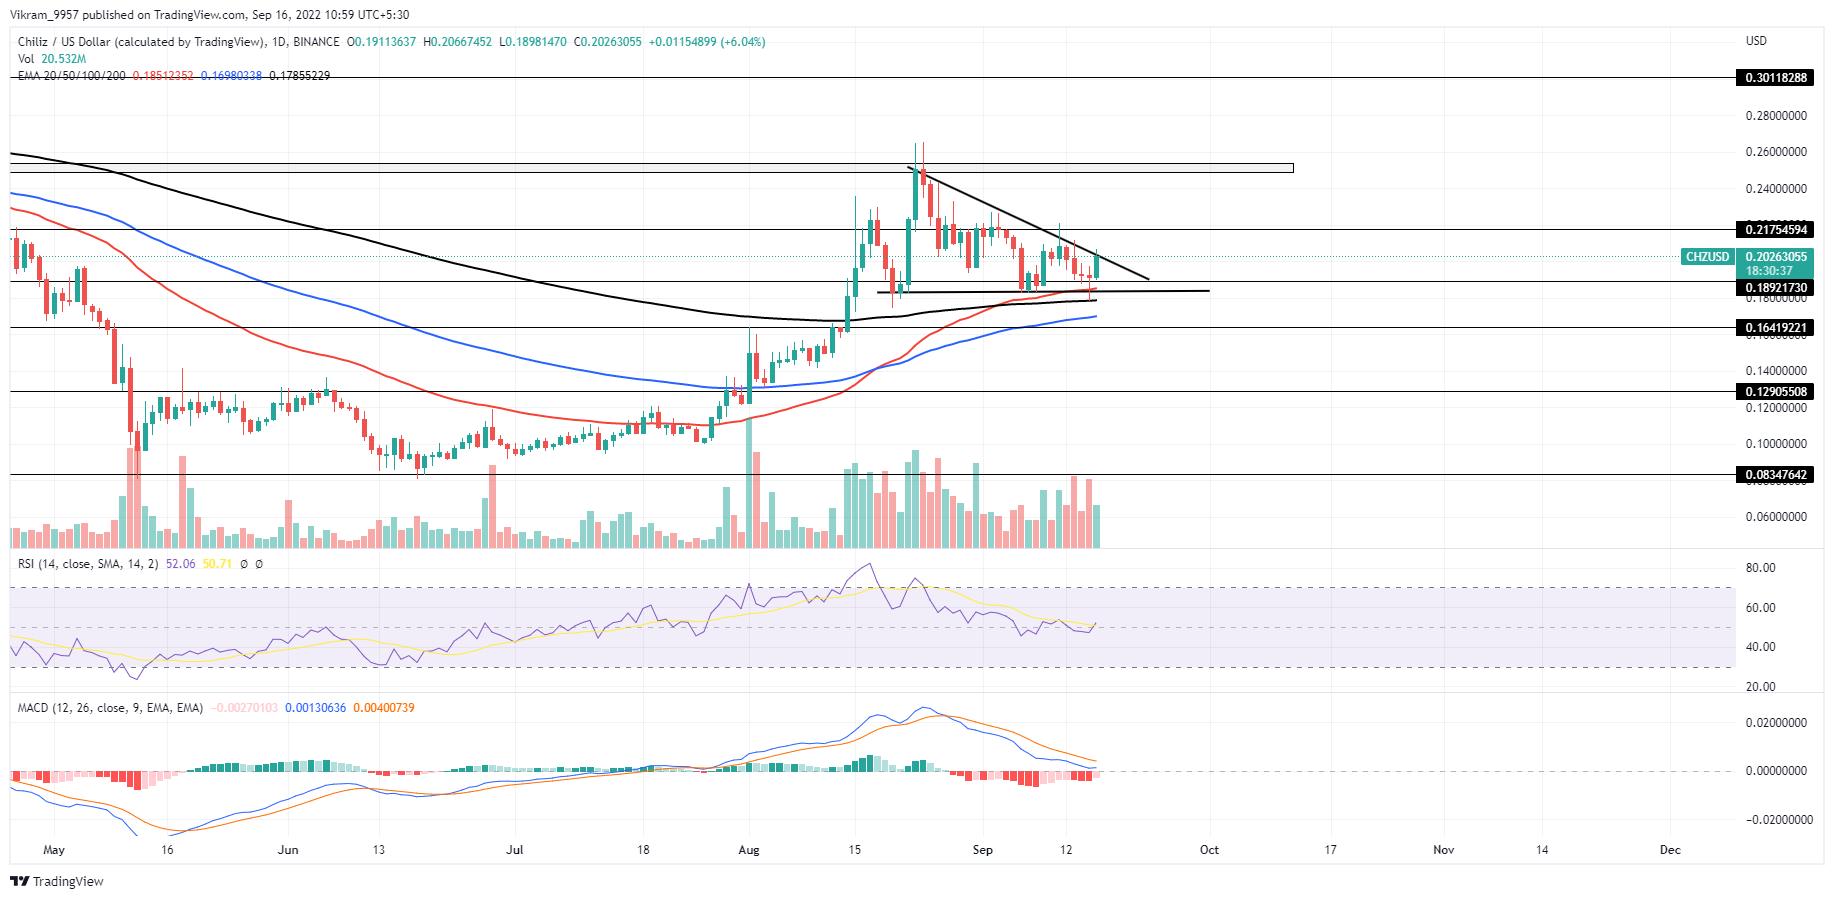 Source - TradingView
CHZ Technical Analysis
The CHZ prices failed to sustain above the $0.20 psychological level, leading to a drop to the $0.18 mark and generating the resistance trend line in the daily chart. Currently, the price action displays a descending triangle pattern with a short-term resistance trendline and bottom support at $0.18. Furthermore, the price action shows a double bottom pattern forming at the triangle's base close to the 50-day EMA completed with a morning star pattern. Finally, the 5.46% jump in the last six hours leads to a bullish engulfing candle teasing a trend line breakout. The spike in the intraday trading volume increases the possibility of a breakout, but the higher price rejection in the daily candle questions the buyer's commitment. Additionally, the crucial daily EMAs maintain an uptrend showing a possibility of a bullish crossover between the 100 and 200-day EMA. A bullish breakout of the short-term resistance line will propel the CHZ market value higher to the $0.25 supply zone, accounting for a price jump of 25%. However, a reversal from the resistance trendline will increase the possibility of a bearish fallout, leading to a price jump to $0.16.
Technical Indicators
The RSI slope shows a slight bearish divergence within the double bottom pattern but struggles to rise above the 14-day SMA. The RSI slope maintains a short-term downtrend, mimicking the price action, struggling to sustain above the halfway line. Moreover, the MACD and signal lines maintain a downward trend, reaching the zero line with constant growth in bearish histograms. As a result, the CHZ Technical Analysis gives a bearish signal for the upcoming trend. Therefore, traders hoping to ride the bullish breakout rally must wait for the price action confirmation. Resistance Levels - $0.22 and $0.25 Support Levels - $0.20 and $0.18