- The UNISWAP is getting a step closer to following the upward trend
- The current price of UNISWAP is approximately $6.50
- The pair of UNI/BTC is around 0.0002996 BTC
The price analysis of UNISWAP shows that it is facing a strong bearish trend in its price. The price of UNISWAP has been moving towards the desired zone of the bears. It seems like these investors of the UNISWAP coin are still not ready to invest in this token because they are waiting for an increase in the potential of the tokens before making any decision and there is no sign of any bullish momentum coming from the current level. As such, investors should look at other options before they invest in UNISWAP.
The UNI’s price is currently hovering at $6.50 and has decreased by 0.81%. The current bearish trend may push the price towards the primary support of $5.71 however, if the bulls’ inactivity persists, the price may fall as low as the secondary support of $5.50 at its full potential. This might be a major milestone for UNI since the price is approaching its all-time low. If so, the price may rise to the primary resistance of $6.68 and, if the bullish trend continues, the secondary resistance of $7.21. Investors are eagerly expecting any changes in direction. To sustain investors’ optimism, the coin has to recover.
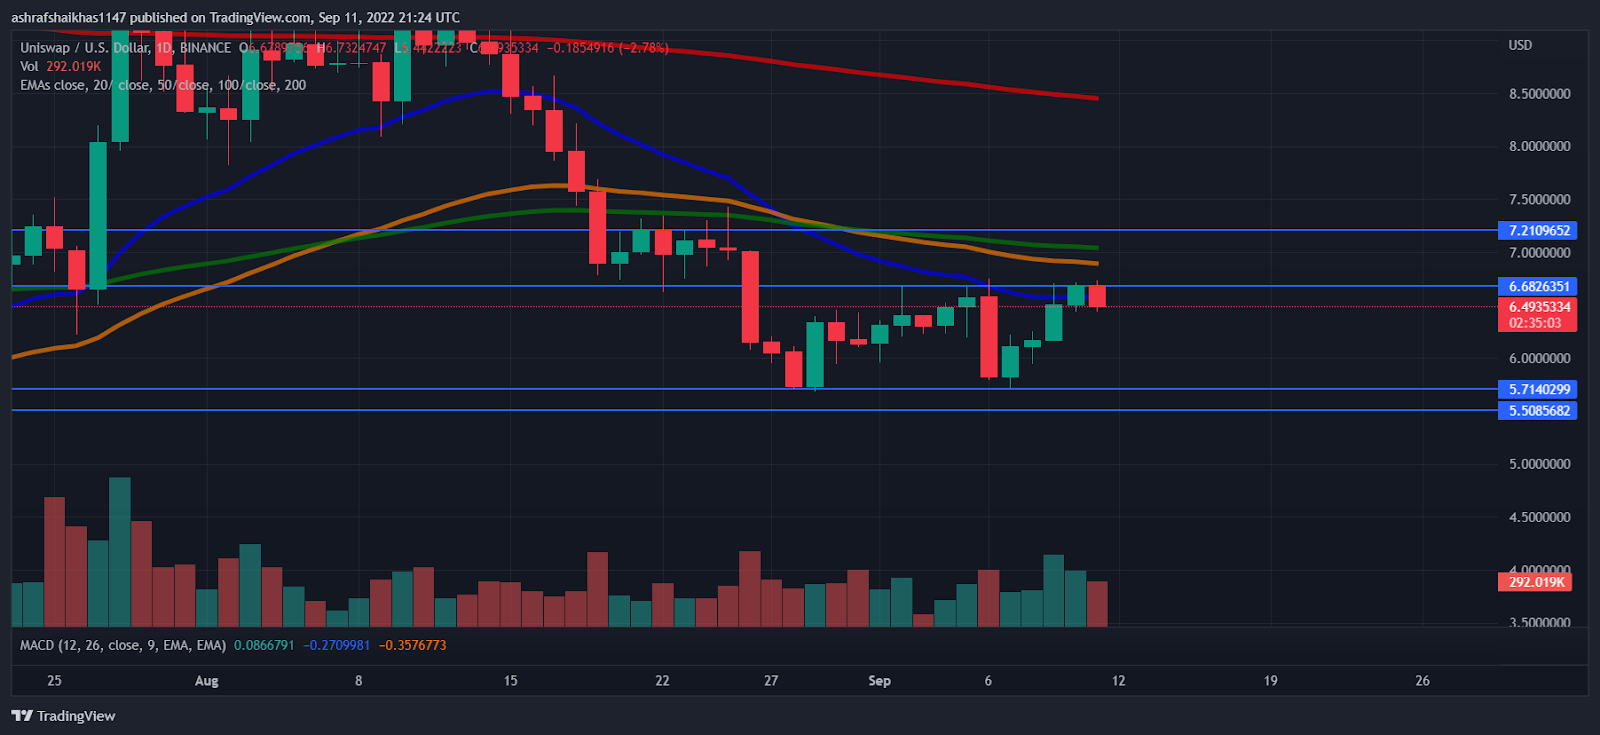
The volume of the coin has decreased by 7.93% the decrease in the volume indicates the sellers are trying to enter the trade of the coins and the short selling pressure over the coin is increasing. The sellers are getting active.
The volume graph below shows that the volume of trading in UNISWAP coins has been steadily increasing over time. The 20-days,50-day, and 100-day exponential moving averages have also collapsed giving a negative cross. the sellers got active and the price started to follow the downward trend now as the Exponential moving average is moving away the price may drop and a bearish trend is dominating the UNI. The price of the coin is lagging behind the 50,100,200 daily moving average.
An evaluation of the UNI’s technical areas
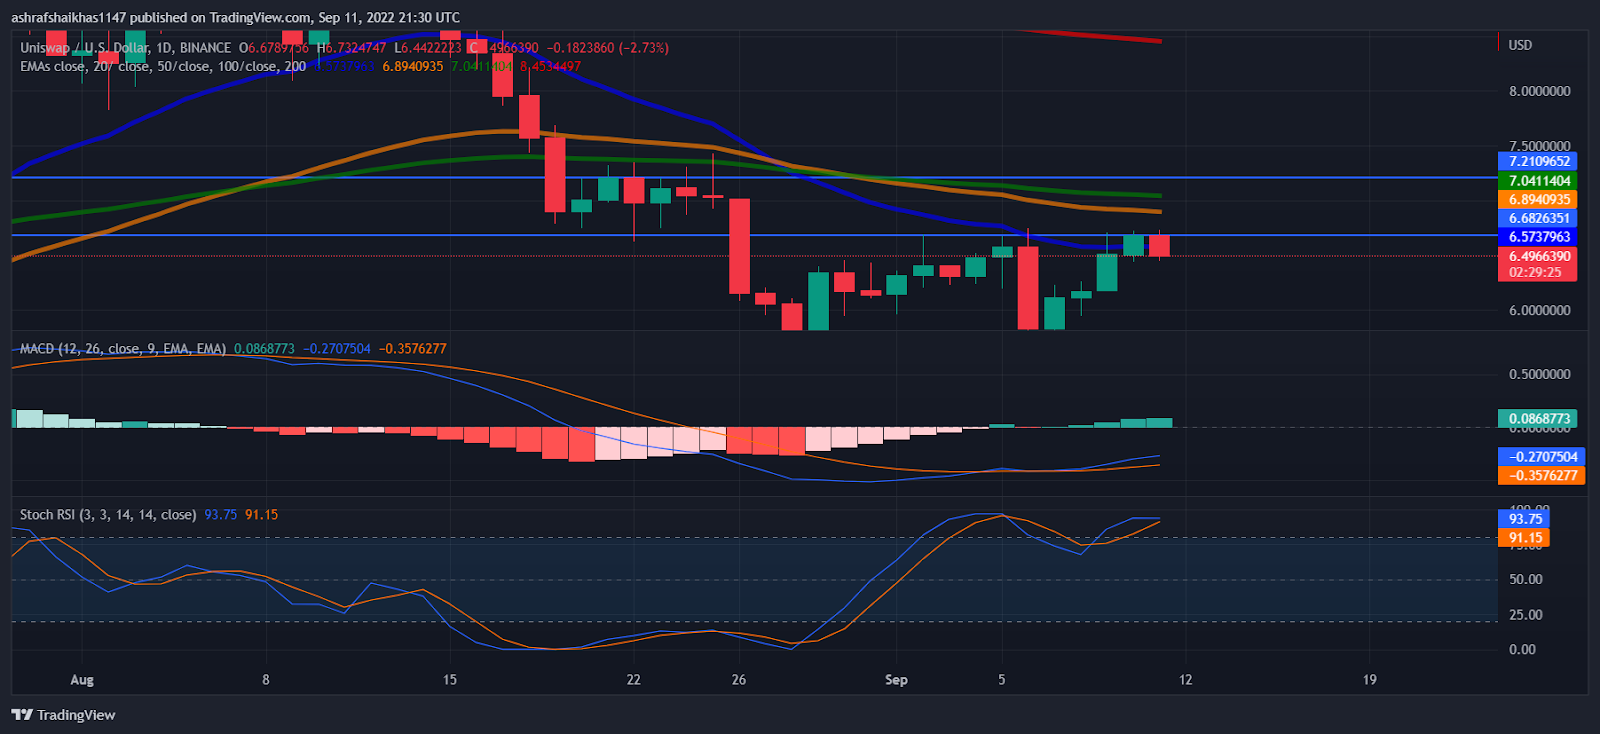
The MACD and MACD signal has collapsed indicating the positive cross now as the MACD and MACD signals are moving apart the price has dropped and the bears have taken over the UNI market. The technical indicators show that the RSI of the coin is getting closer to the oversold zone the seller has pushed the RSI to the oversold zone and now the buyers have to get action to neutralize the RSI. The current RSI is around 46.66 and it is above the average RSI of 41.26. The Stoch RSI is reversing from the over brought zone.
Conclusion
The UNI’s price is currently hovering at $6.50 and has decreased by 0.81%. during the intraday trading session. The volume of the coin has decreased by 7.93%. The current RSI is around 46.66 and it is above the average RSI of 41.26. The price of the coin is lagging behind the 50,100,200 daily moving average. The bears are dominating the market UNI.
Technical Levels
Support Levels: $5.71 and $5.50
Resistance Levels: $6.68 and $7.21
Disclaimer
The views and opinions stated by the author, or any people named in this article, are for informational ideas only. They do not establish the financial, investment, or other advice. Investing in or trading crypto assets comes with a risk of financial loss.