- The Chiliz is getting a step closer to following the upward trend
- The current price of Chiliz is approximately $0.029 with a total increase of 4.79% during the intraday trading session
- The pair of CHZ/BTC is around
The price of Chilliz is now following the upward curve with a steady upward momentum. so that it can grow over time. It suggests that the coin’s price will rise. The bullish trend for Chilliz might develop or intensify if the price rises. Chilliz, that is currently rising, but the bears may try to bring the downfall of the coin. A breakdown of the support level would indicate a potential decrease in Chilliz’s price. However, if the bulls have a solid plan for the coin or its future growth, then prices may climb as more investors begin to enter the trade.
The current price of the coin is surfing around $0.2083 with a total incline of 3.40% during the intraday trading session. The pair of CHZ/BTC is around 0.000009617 BTC With a total incline of 1.53% the coin price is very volatile the bulls and bears both want to drag the price to their desired targets but it seems that the bulls are leading as the price is about to follow the upward curve if the bulls dominate the CHZ the price may reach upto the primary resistance of $0.2207 and if the bear’s stillness continuous the price of the token may reach to the secondary resistance of $0.2518. If the bears try to enter the trade the price may drop upto the primary support of $0.2011 if the bears could bring the downward trend the price could reach upto secondary support $0.1846.
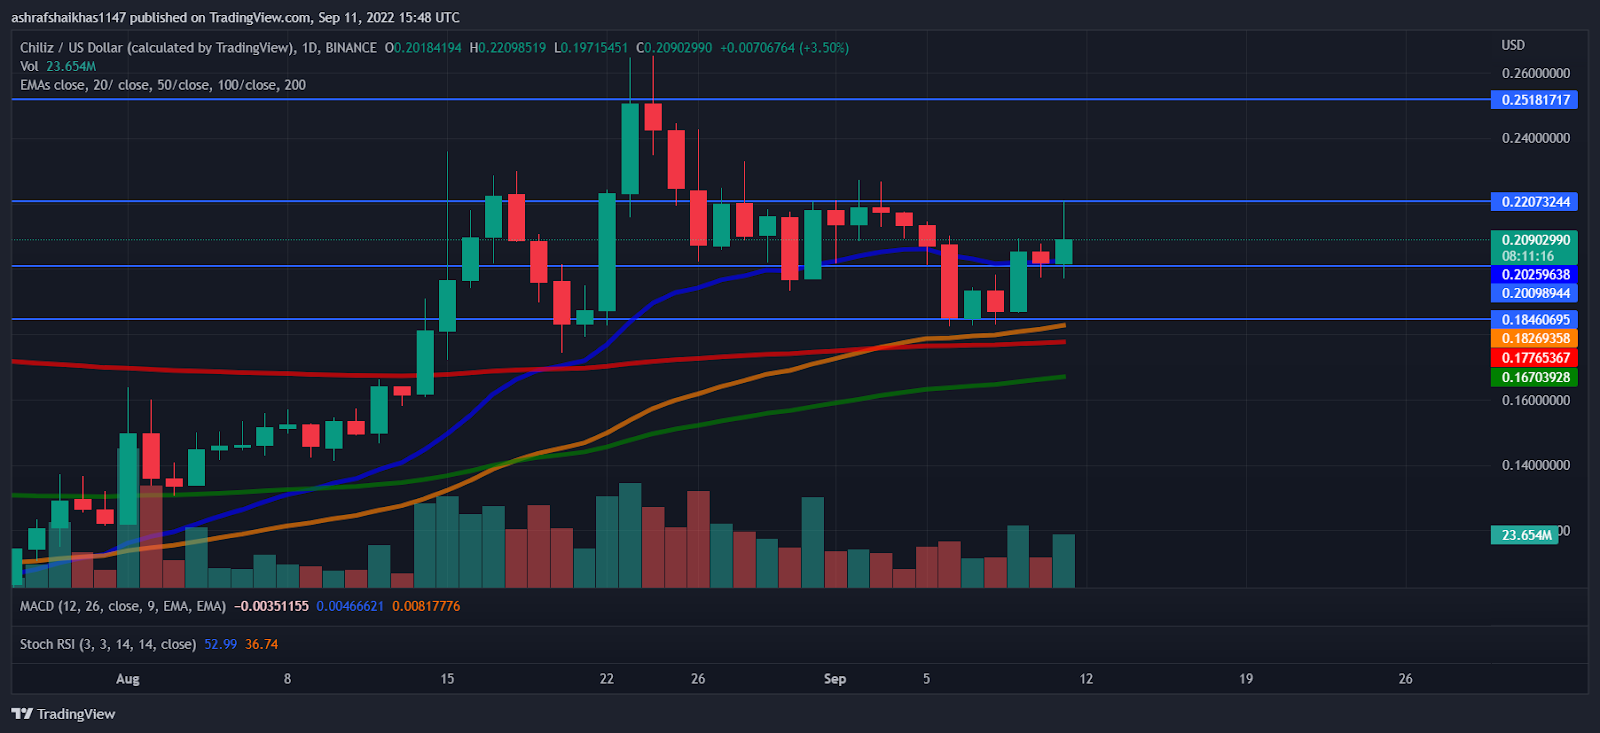
The increase in the volume of CHZ during the intraday trading session is approx 60.54%. The volume to market cap ratio is 0.298. The continuous increase in the volume of coins indicates that the short-selling pressure is decreasing. At the moment, the price of Chiliz is not too far from its all-time high. It seems that investors are still bullish on this coin. The ongoing bearish trend shows that investors are still bearish toward the coin.
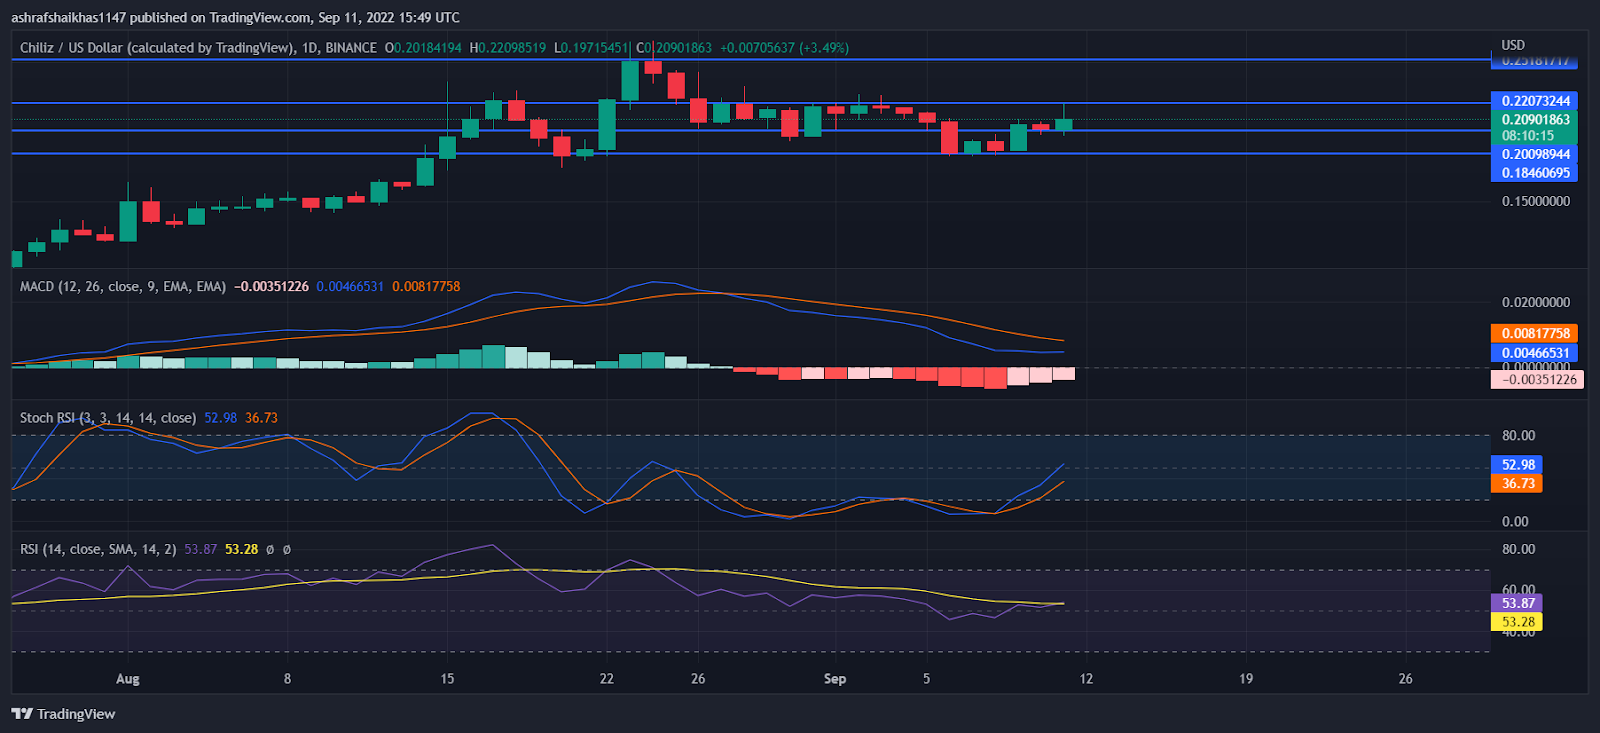
The MACD and MACD signal has collapsed indicating the negative cross the price has dropped ade the bears have taken over the CHZ market. The 50-days and the 100-day exponential moving average have also collapsed giving a negative cross. The sellers got active and the price started to follow the downward trend now as the Exponential moving average is moving away the price may drop and a bearish trend is dominating the CHZ. The price of the coin is above the 20,50,100,200 daily moving average.
The technical indicators show that the RSI of the coin is getting closer to the overbrought zone the seller has pushed the RSI to the oversold zone and now the buyers have to get action to neutralize the RSI. The current RSI is around 53.06 and it is below the average RSI of 53.22.
Technical Levels
Support Levels: $0.1846 and $0.2009
Resistance Levels: $0.2207 and $0.2518
Disclaimer
The views and opinions stated by the author, or any people named in this article, are for informational ideas only. They do not establish the financial, investment, or other advice. Investing in or trading crypto assets comes with a risk of financial loss.