- The bears are trying to enter the trade. The bulls are getting weak
- The current price of ADA is approx $0.5114
- The pair of ADA/BTC is around 0.00002369 BTC
The Cardano has started to follow the upward curve the coin is following the upward curve with a steady upward trend. The ADA had potential, but the bears have pushed the token’s price towards the bear’s desired zone, brushing the investor’s hope that the ADA has started to regain its potential after a long period. The bulls have acquired superior techniques to build a better market for the investors of ADA. The bulls have driven themselves to bring the upward trend while the bears have tried to manipulate the market.
The bears’ plan to diminish the coin’s potential didn’t work as planned. It seemed that the bulls had taken over the market of Cardano, Now the bullish trend is continuous. But the bears are trying to enter the trade to bring the downward momentum
The Cardano has dropped around 0.90% during the intraday trading session and is surfing around $0.5114 the declining price indicates that the coin is again losing its potential and the token may start to follow the downward curve with a steady downward momentum if the bears succeed in entering the trade the price of the coin may drop upto the primary support of approx $0.461
. If the bears take over the coin the price may follow the downward trend then the price could fall upto the secondary support of $0.428. If the bulls could make it upto the plate to raise hopes for the investors the price could boost upto the primary resistance of $0.540 the price could also follow upward if the bulls push themselves a bit more and the price may reach the secondary resistance of $0.571 bringing new hope for the investors
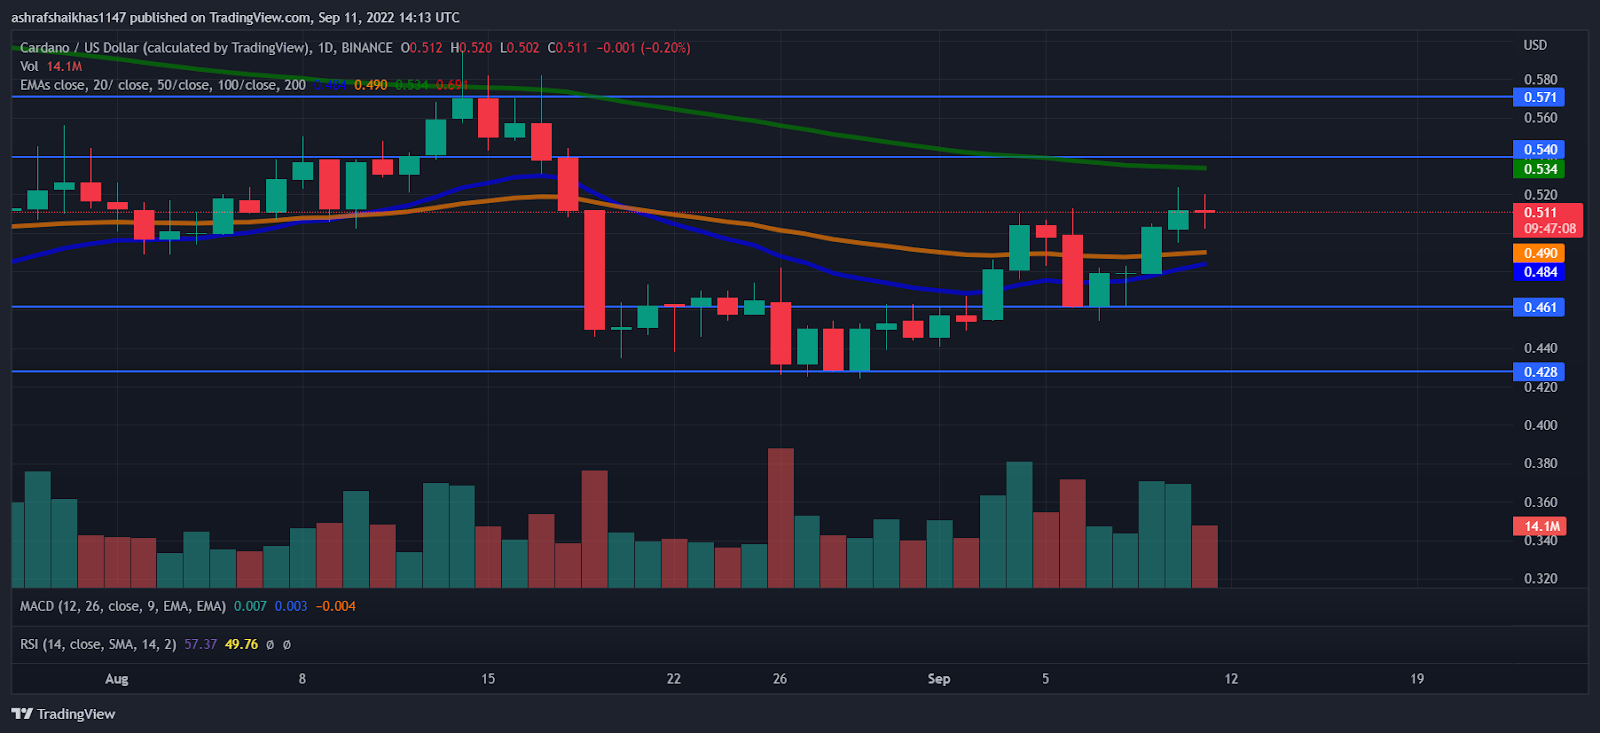
The volume of the ADA coin has decreased by around 25.55% the decreasing volume indicates that the short selling pressure over the coin is increasing the sellers have got activated the buyers have to make a move. The Estimated moving average of 20 days and 50 days are about to collide the Estimated moving average has collided earlier giving a negative cross the coins price is moving ahead of the 20 days, 50 days Estimated moving average but is still lagging behind the 100 and 20 days daily moving average.
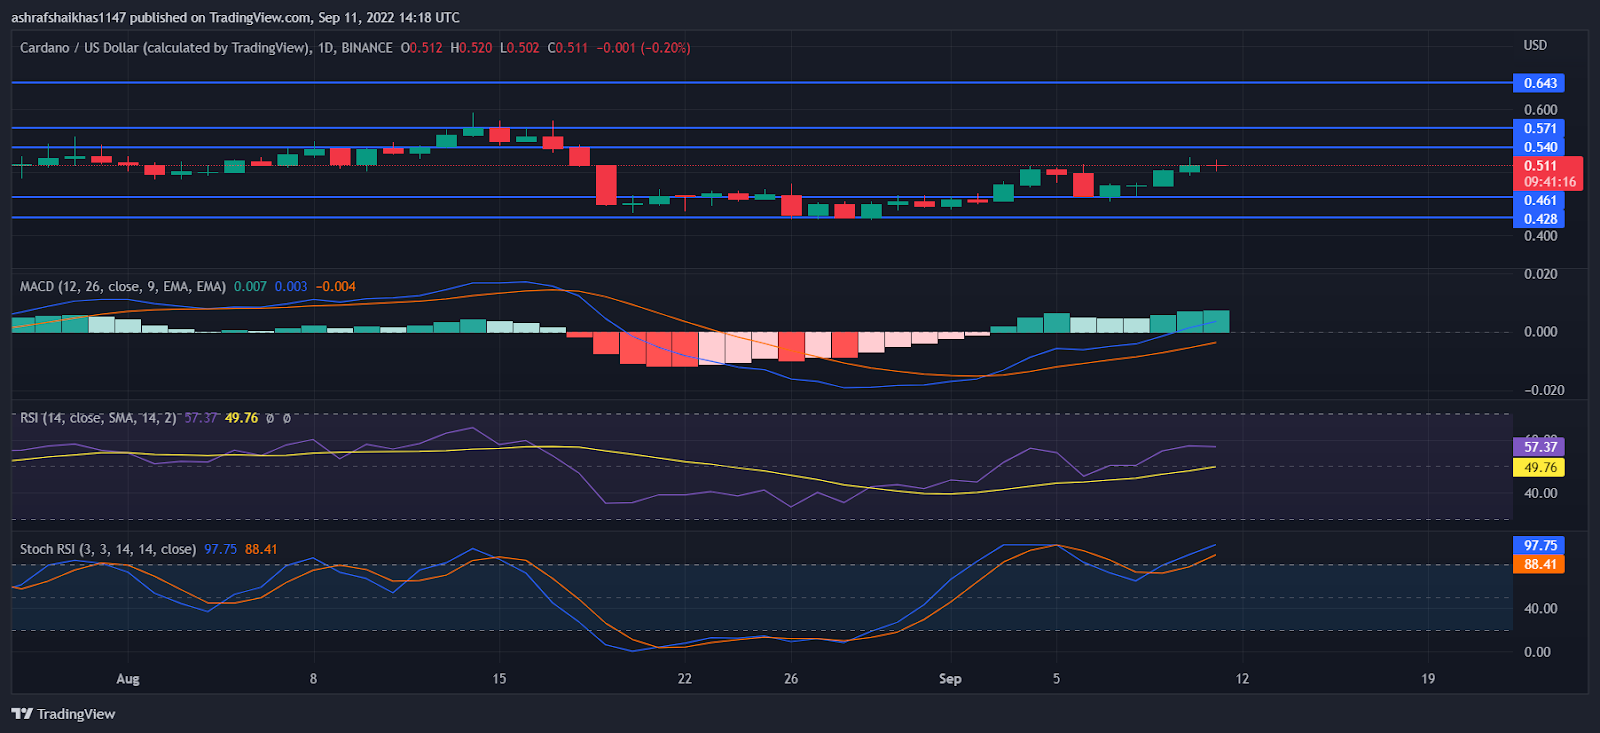
The MACD and MACD signals are repelling and moving away this could bring an indication that the price could move on either side over the daily price chart. The MACD and MACD signal have collapsed previously giving the positive cross now the investors have to wait for any movement. The Stoch RSI is in the overbought zone and is around 95.97 and the average stoch RSI is around $88.01. This suggests that this might be a turning point for the coin the seller may get activated. The RSI of the coin is still in the overbought zone and is around 56.80 and is above the average RSI which is 49.72. The investors have to wait for any directional change over the daily price chart.
Conclusion
The Cardano has dropped around 0.90% during the intraday trading session and is surfing around $0.5114. The volume of the coin decreased by around 25.55% during the intraday trading session. The MACD and MACD signals are repelling and moving away. The Stoch RSI is around 95.97 and the average stoch RSI is around 88.01. The RSI of the coin is around 56.80 and the average RSI is 49.72.
Technical Levels
Support Levels: $0.461 and $0.428
Resistance Levels: $0.540 and $0.571
Disclaimer
The views and opinions stated by the author, or any people named in this article, are for informational ideas only. They do not establish the financial, investment, or other advice. Investing in or trading crypto assets comes with a risk of financial loss.