Bitcoin is up by a strong 7.6% this week as the cryptocurrency breaks $20,000 and heads above $21,000. The market looked fairly gloomy earlier in the week after BTC fell under $19,000. However, the buyers quickly regrouped and started a rally higher toward the end of the week.
As a result, the entire altcoin market is seeing some well-deserved gains after a troubling two weeks, with some surging much higher than Bitcoin in the period.
Today, we will look at Bitcoin (BTC), Ethereum (ETH), Cardano (ADA), Solana (SOL), and Binance Coin (BNB). In addition, we will highlight some support and resistance areas and see where the market can go next week.
Bitcoin price analysis
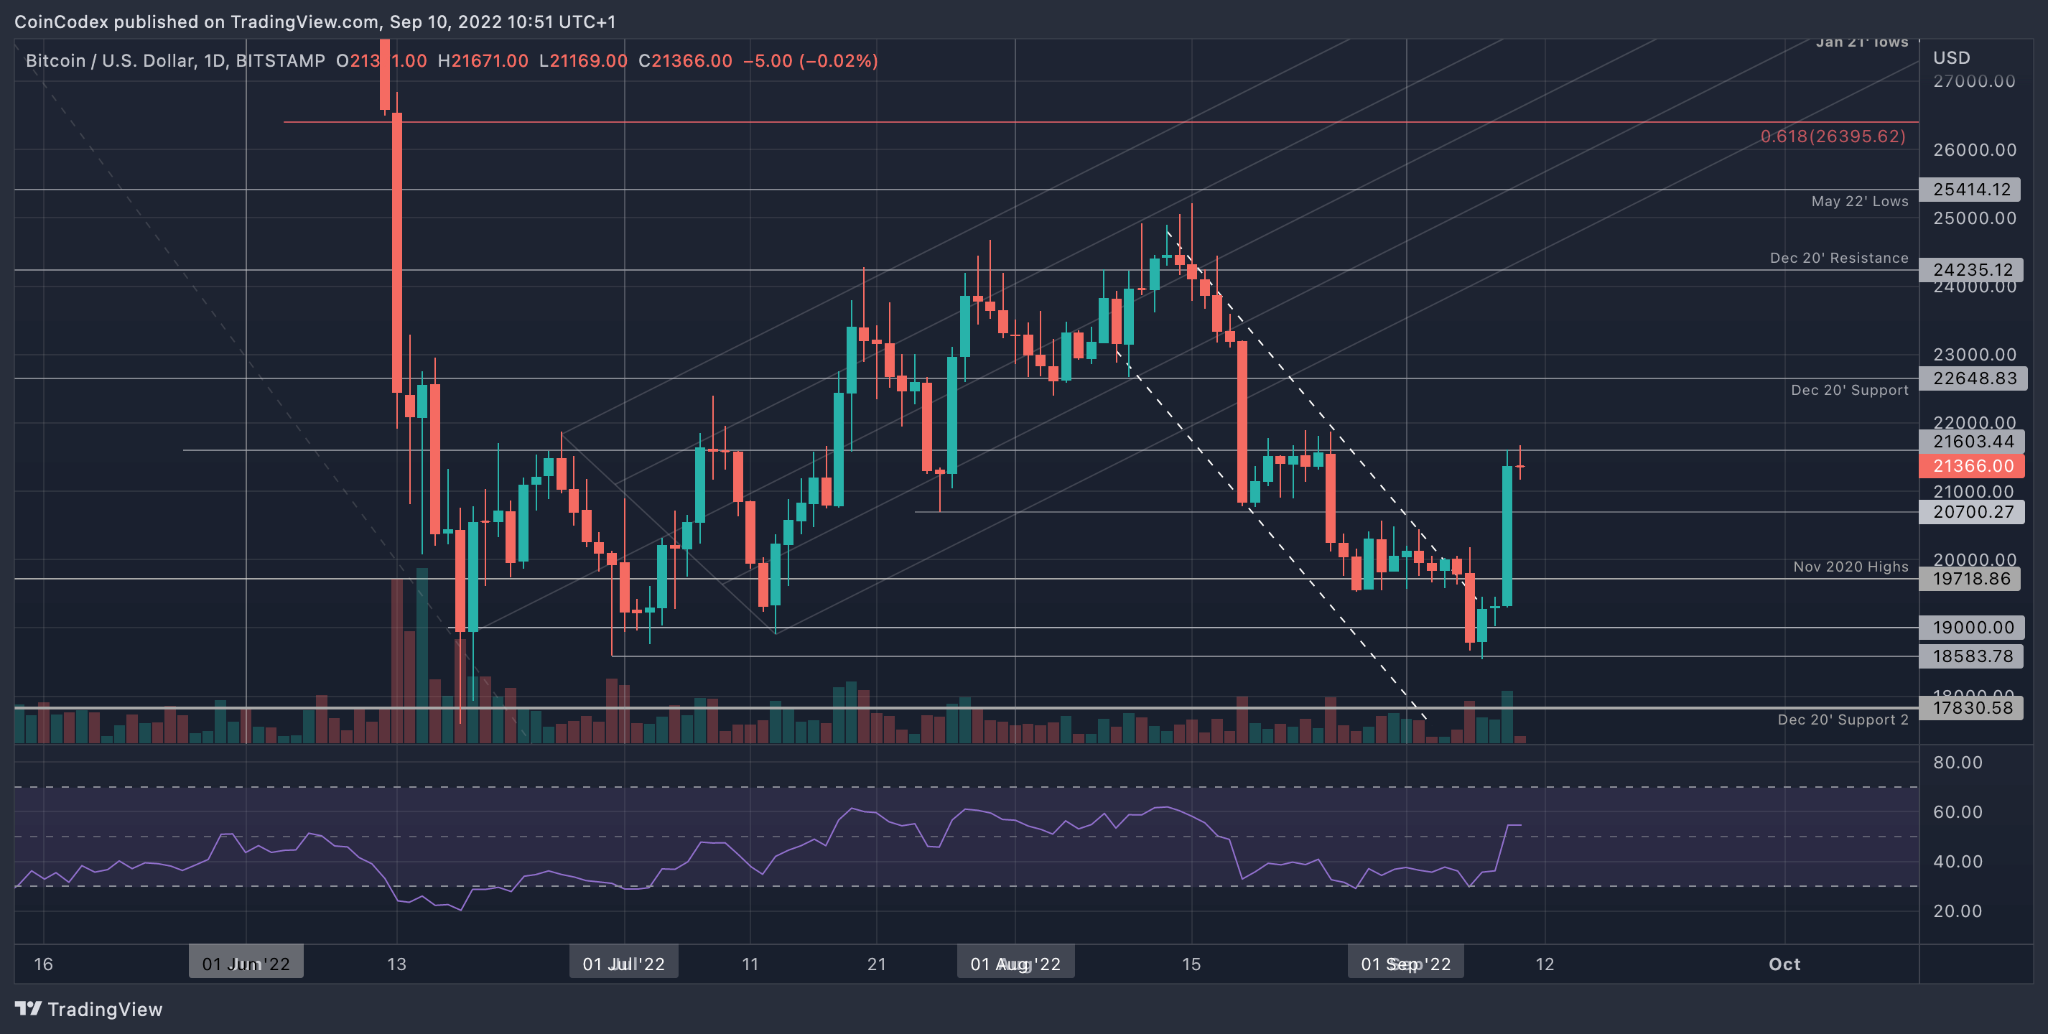
This week, BTC/USDT saw a strong 7.5% price surge as the cryptocurrency finally broke back above $21,000. Bitcoin started the week on a bearish tone as it sank beneath $20,000. Many traders were hoping the support at $19,720 would hold. However, BTC continued beneath the level and continued to plummet on Tuesday to reach as low as $18,585 on Wednesday.
Luckily, the buyers regrouped here to stall the decline and recovered $19,000 by the end of the day. The strong surge above $20,000 and $21,000 occurred yesterday when BTC climbed from $19,500 to reach as high as $21,600. It has since dropped slightly as it currently trades at $21,366.
Keep up-to-date with all the latest BTC predictions.
Short-term trend: Neutral
BTC is now considered neutral again, and a break above $21,600 would open up a short-term bullish trend. For a more sustained bull run, BTC would need to break back above $25,000. On the other side, a drop beneath $19,720 would turn the market bearish again.
Looking ahead, the first resistance lies at $21,600. This is followed by resistance at $22,000, $22,650 (Dec 2020 support), $23,000, $24,235 (December 2020 resistance), and $25,000.
On the other side, support is first located at $21,000. This is followed by $20,700, $20,000, $19,720 (Nov 2020 highs), $19,000, and $18,585.
Ethereum price analysis
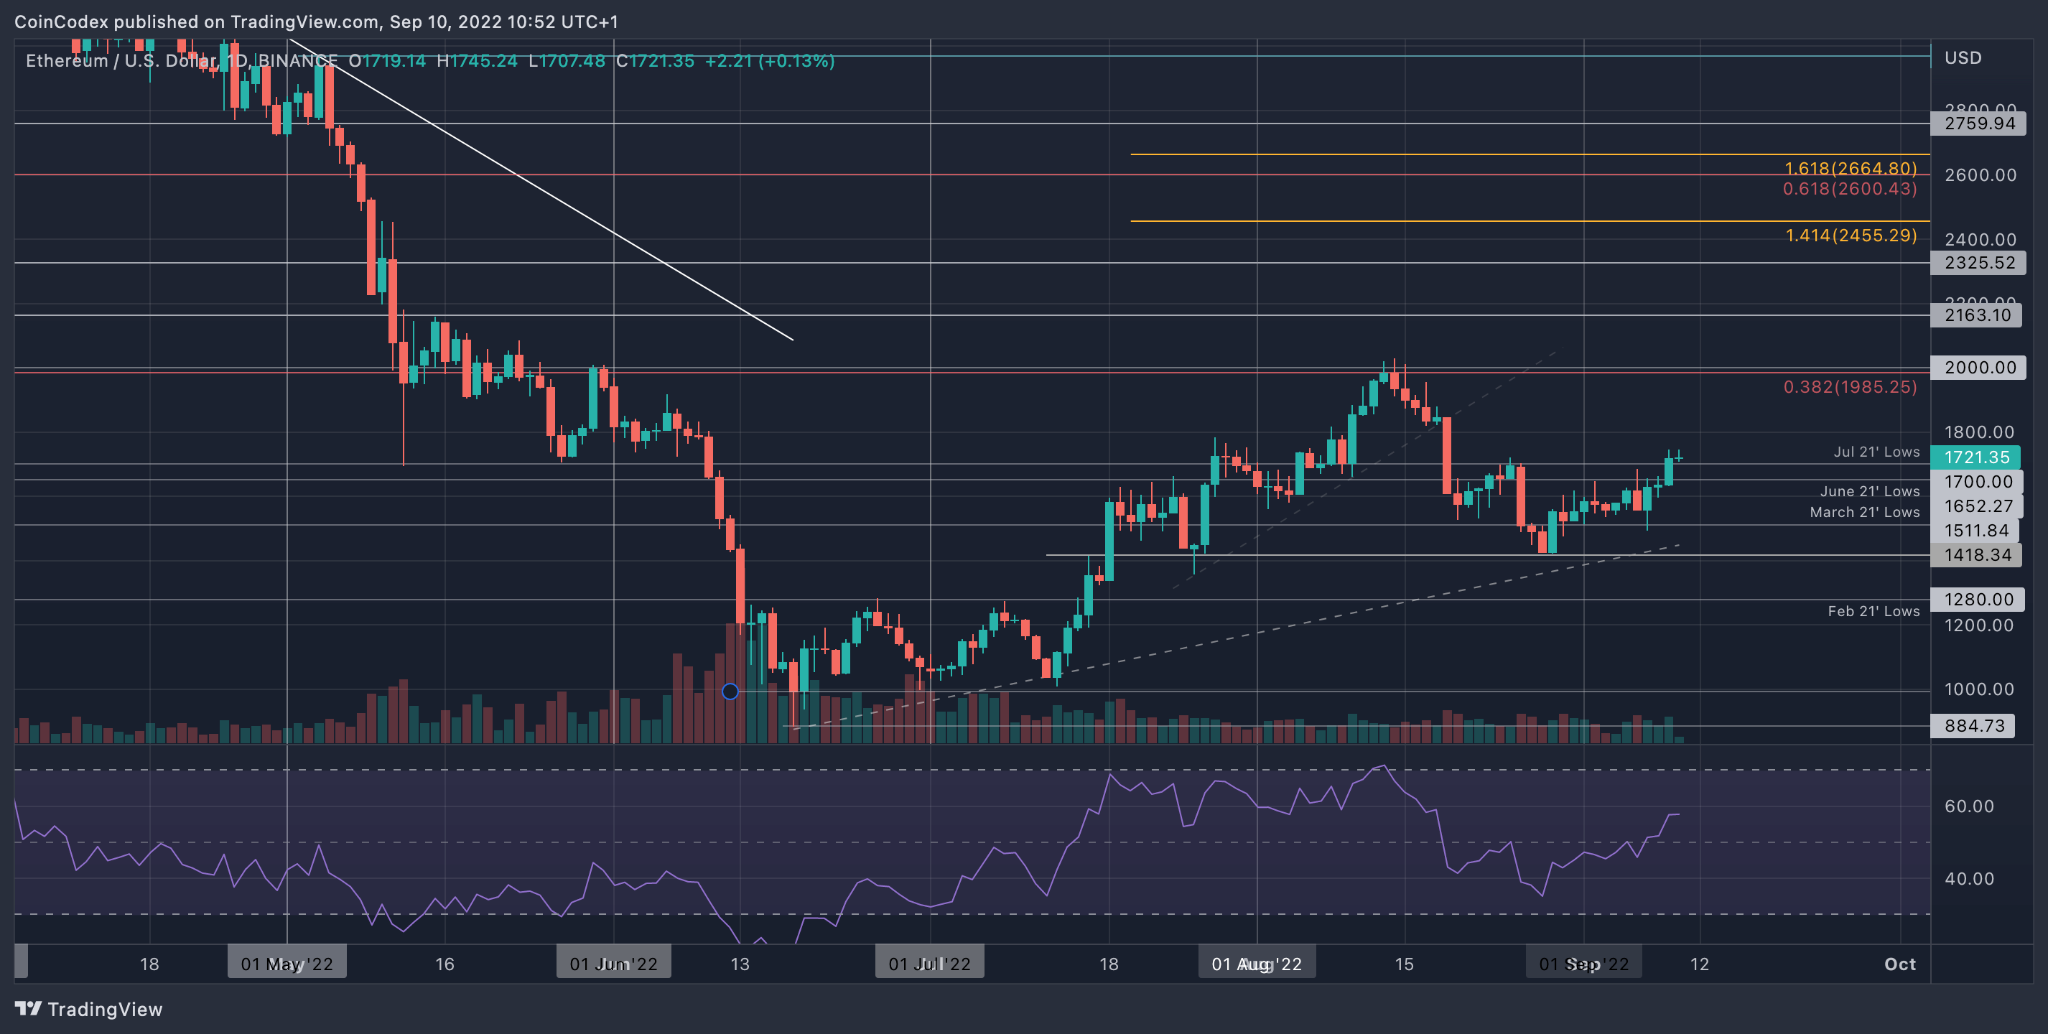
ETH/USD is down by a small 3% this week as the coin trades just above $1,600. The coin rolled over from resistance at $1,700 last Friday and fell as low as $1,410 over the weekend.
The buyers regrouped on Monday, allowing ETH to start to rebound. It quickly broke back above the 100-day MA at $1,510 and has pushed as high as $1,600 today. Nevertheless, it is producing lower highs and lower lows and will need to break $1,700 to end this.
Keep up-to-date with all the latest ETH predictions.
Short-term trend: Bullish above $2,000
Ethereum would need to break back above $2,000 to be considered bullish again. A drop beneath $1,500 would send ETH back into a bearish spiral. The break above $1,700 is considered very optimistic for ETH.
Looking ahead, the first level of resistance lies at $1,800. This is followed by strong resistance at $2000, which stalled the market in August. Above the August highs, resistance lies at $2,162, $2,200, $2,325, and $2,455.
On the other side, the first support lies at $1,700. This is followed by $1,652, $1,511, $1,500, and $1,418.
ADA price analysis
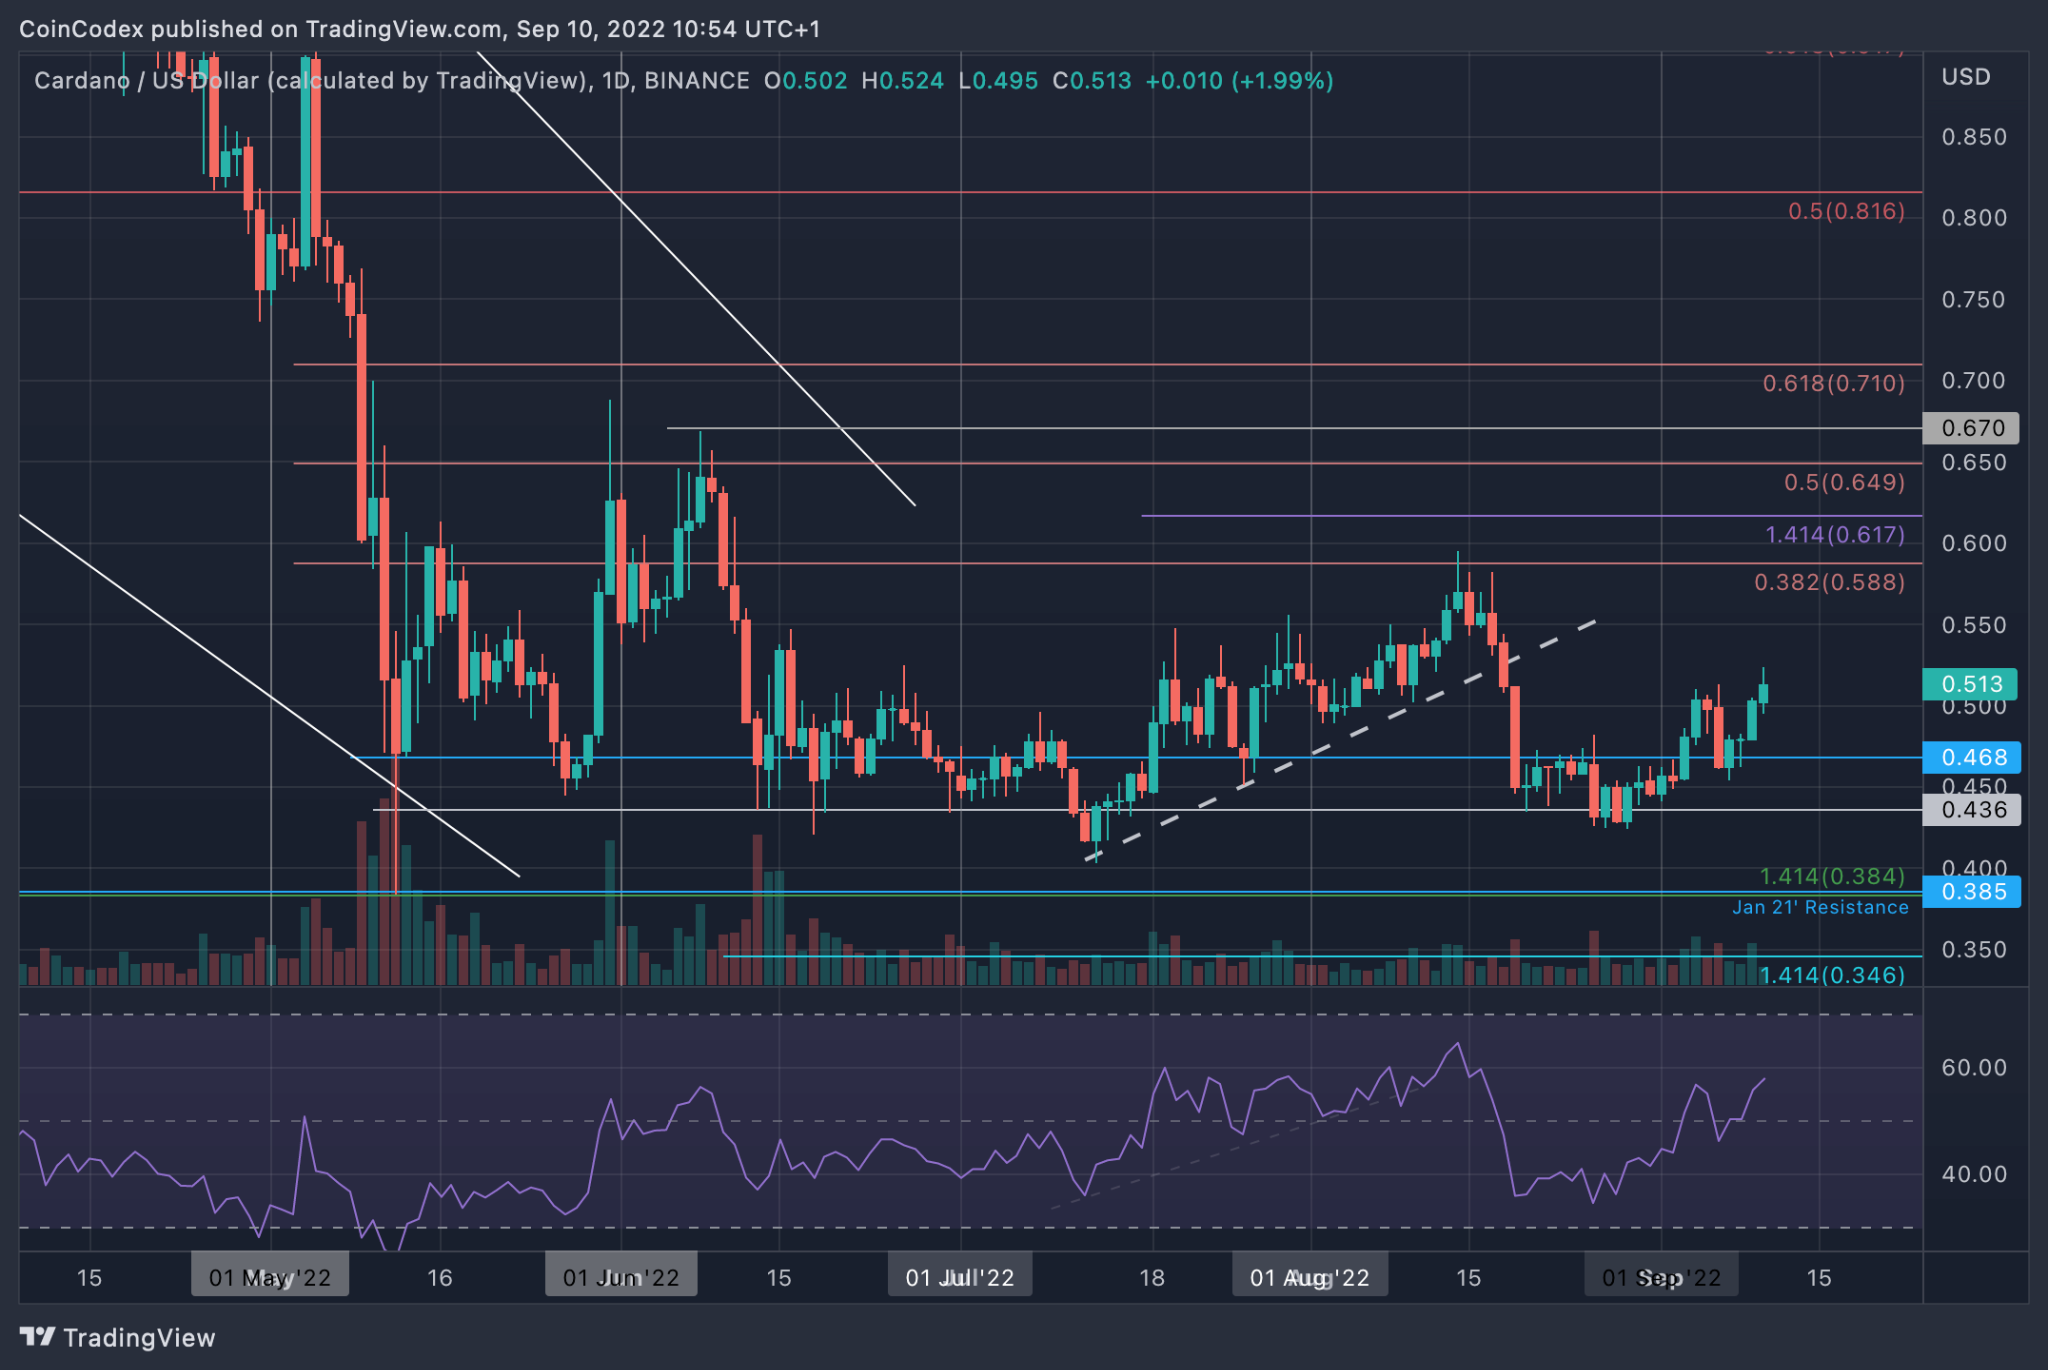
ADA/USDT is up by 9.5% over the week as the cryptocurrency finally reclaims territory above $0.5. The cryptocurrency sank as low as $0.42 toward the end of August and started to recover from there slowly.
It did manage to break $0.5 in the first week of September but sank beneath the level at the beginning of the current week. Luckily, the buyers regrouped by Wednesday, allowing ADA to break back above $0.5 today. It is currently trading at $0.513.
ADA is now ranked in the 7th position with a market cap value of $17.35 billion.
Keep up-to-date with all the latest ADA predictions.
Short-term trend: Bullish above $0.6
ADA would need to break the resistance at $0.6 to turn bullish. A break beneath $0.43 will turn ADA bearish in the short term.
Looking ahead, the first resistance lies at $0.55. This is followed by resistance at $0.588 (bearish .382 Fib), $0.6, $0.617 (1.414 Fib Extension), and $0.65 (bearish .5 Fib).
On the other side, the first support lies at $0.5. This is followed by $0.468, $0.45, $0.436, and $0.43.
Solana price analysis
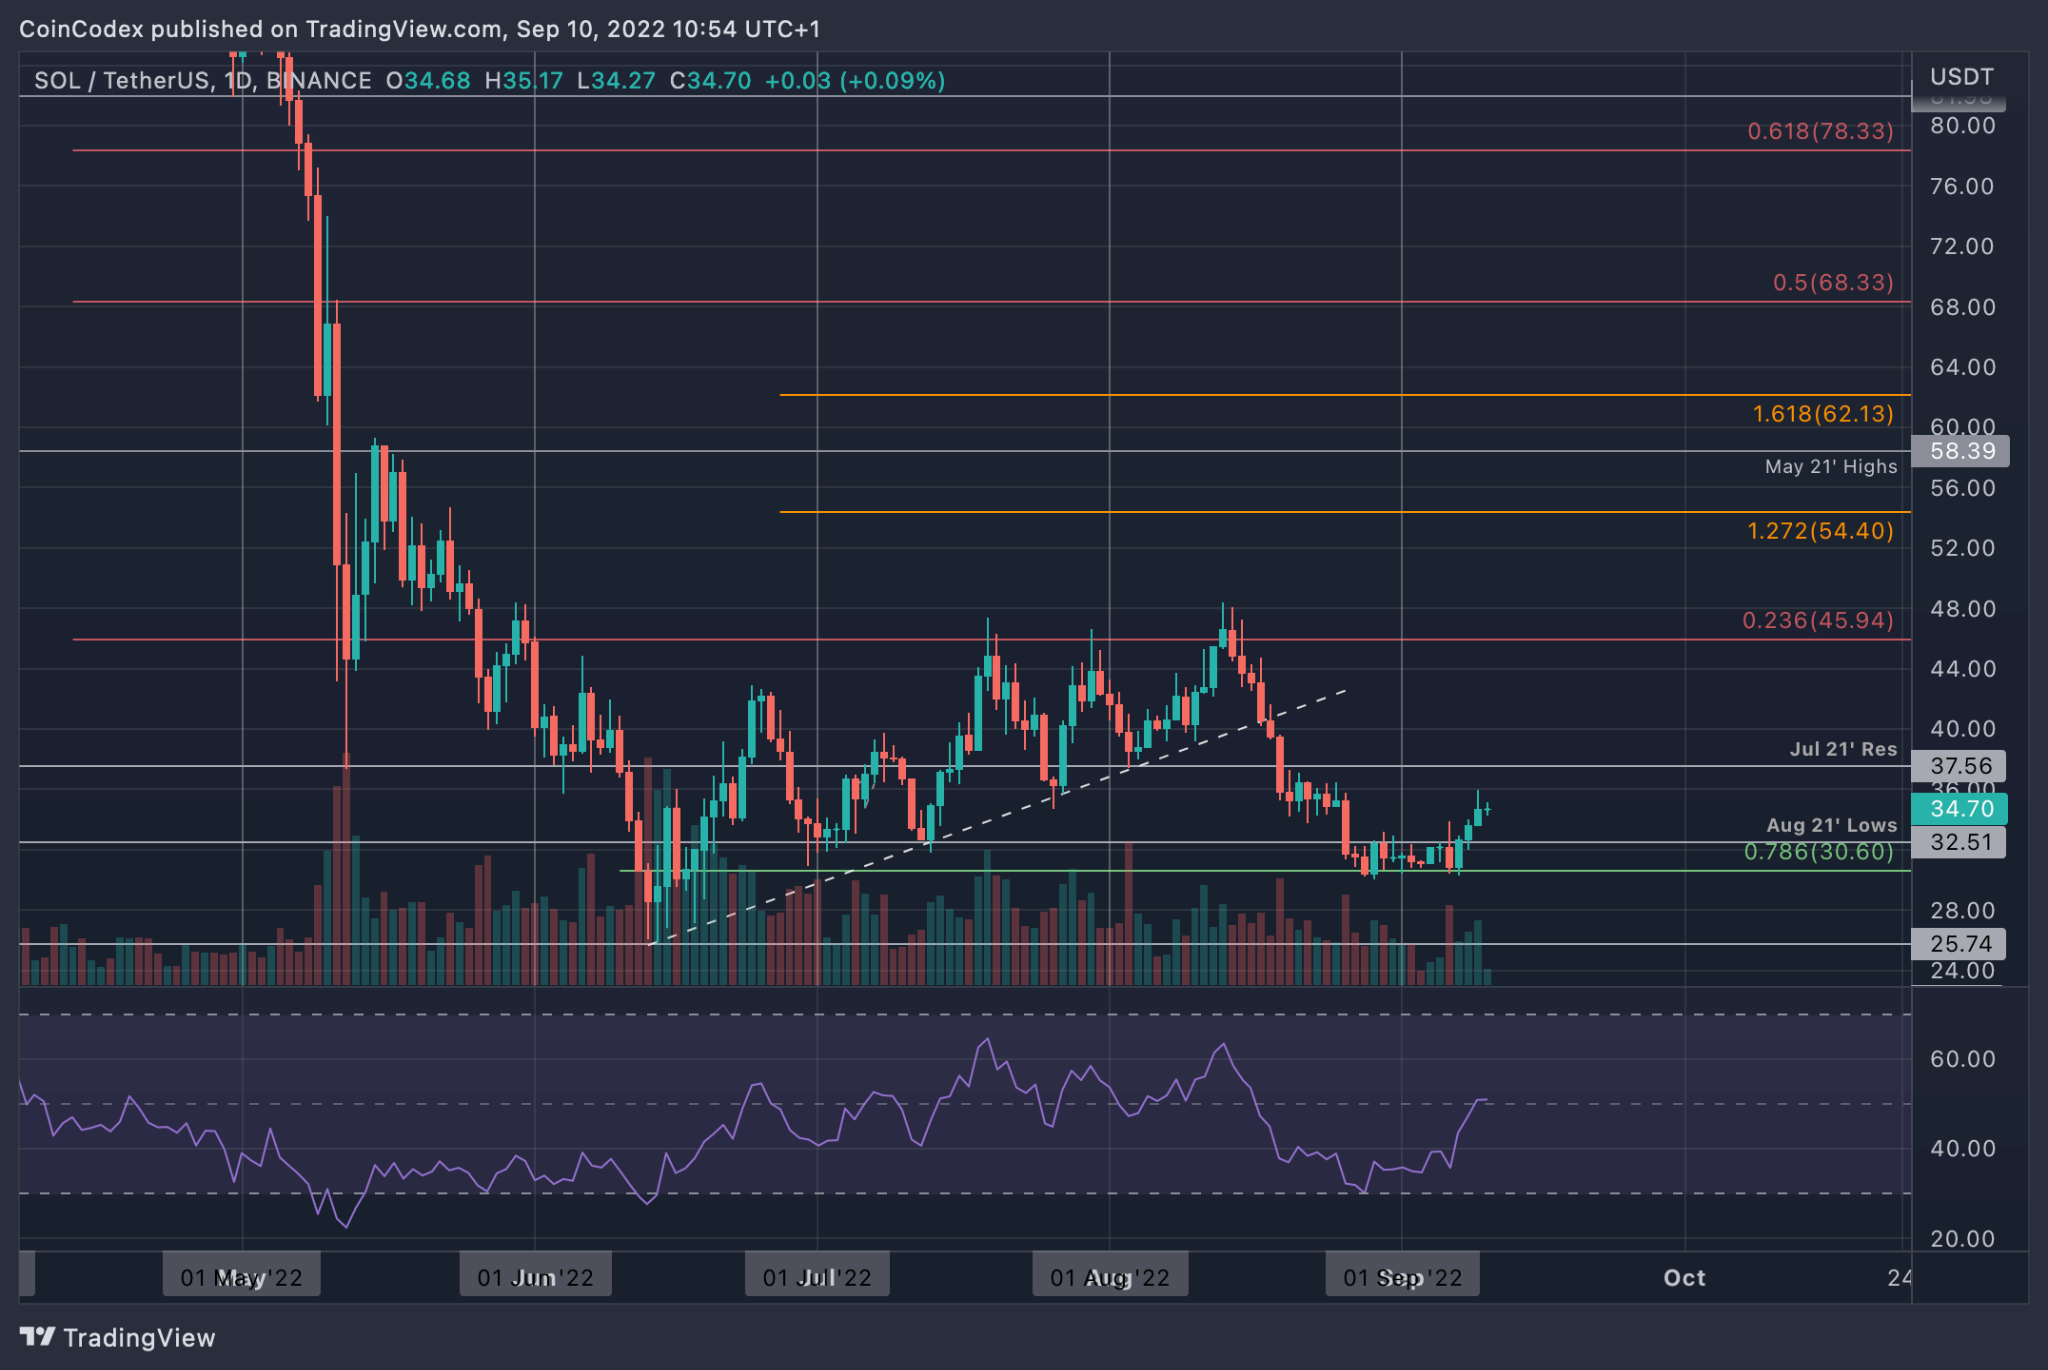
SOL/USDT witnessed an epic 11.5% price surge over the week as the coin runs back toward $36. The cryptocurrency fell from a high of $48 in August to reach as low as $30 by the end of the month.
SOL held the support at $30 in the first few days of September, and started to push higher from there on Wednesday. Yesterday, SOL reached as high as $36 but had since dropped to $34.70.
SOL is now ranked in the 9th position as it holds a market cap value of $12.28 billion.
Keep up-to-date with all the latest SOL predictions.
Short-term trend: Bullish above $48
SOL is still a long way from turning bullish as it would need to break $48. A break beneath $30 would turn SOL bearish.
Looking ahead, the first resistance above $36 lies at $37.56 (Jul 2021 resistance). This is followed by $40, $44, $46 (bearish .236 Fib), $48, and $50.
On the other side, support lies at $32.50 (August 2021 lows), $30.60 (.786 Fib), and $30.
BNB price analysis
BNB/USDT is up by a small 6.6% this week as the coin knocks on the door of the $300 resistance again. BNB fell beneath a trend line earlier in the week but fortunately found support at $260 (.5 Fib Retracement).
It has since recovered back above the trend line and broke above $290 yesterday as it makes its way back toward $300.
Keep up-to-date with all the latest BNB predictions.
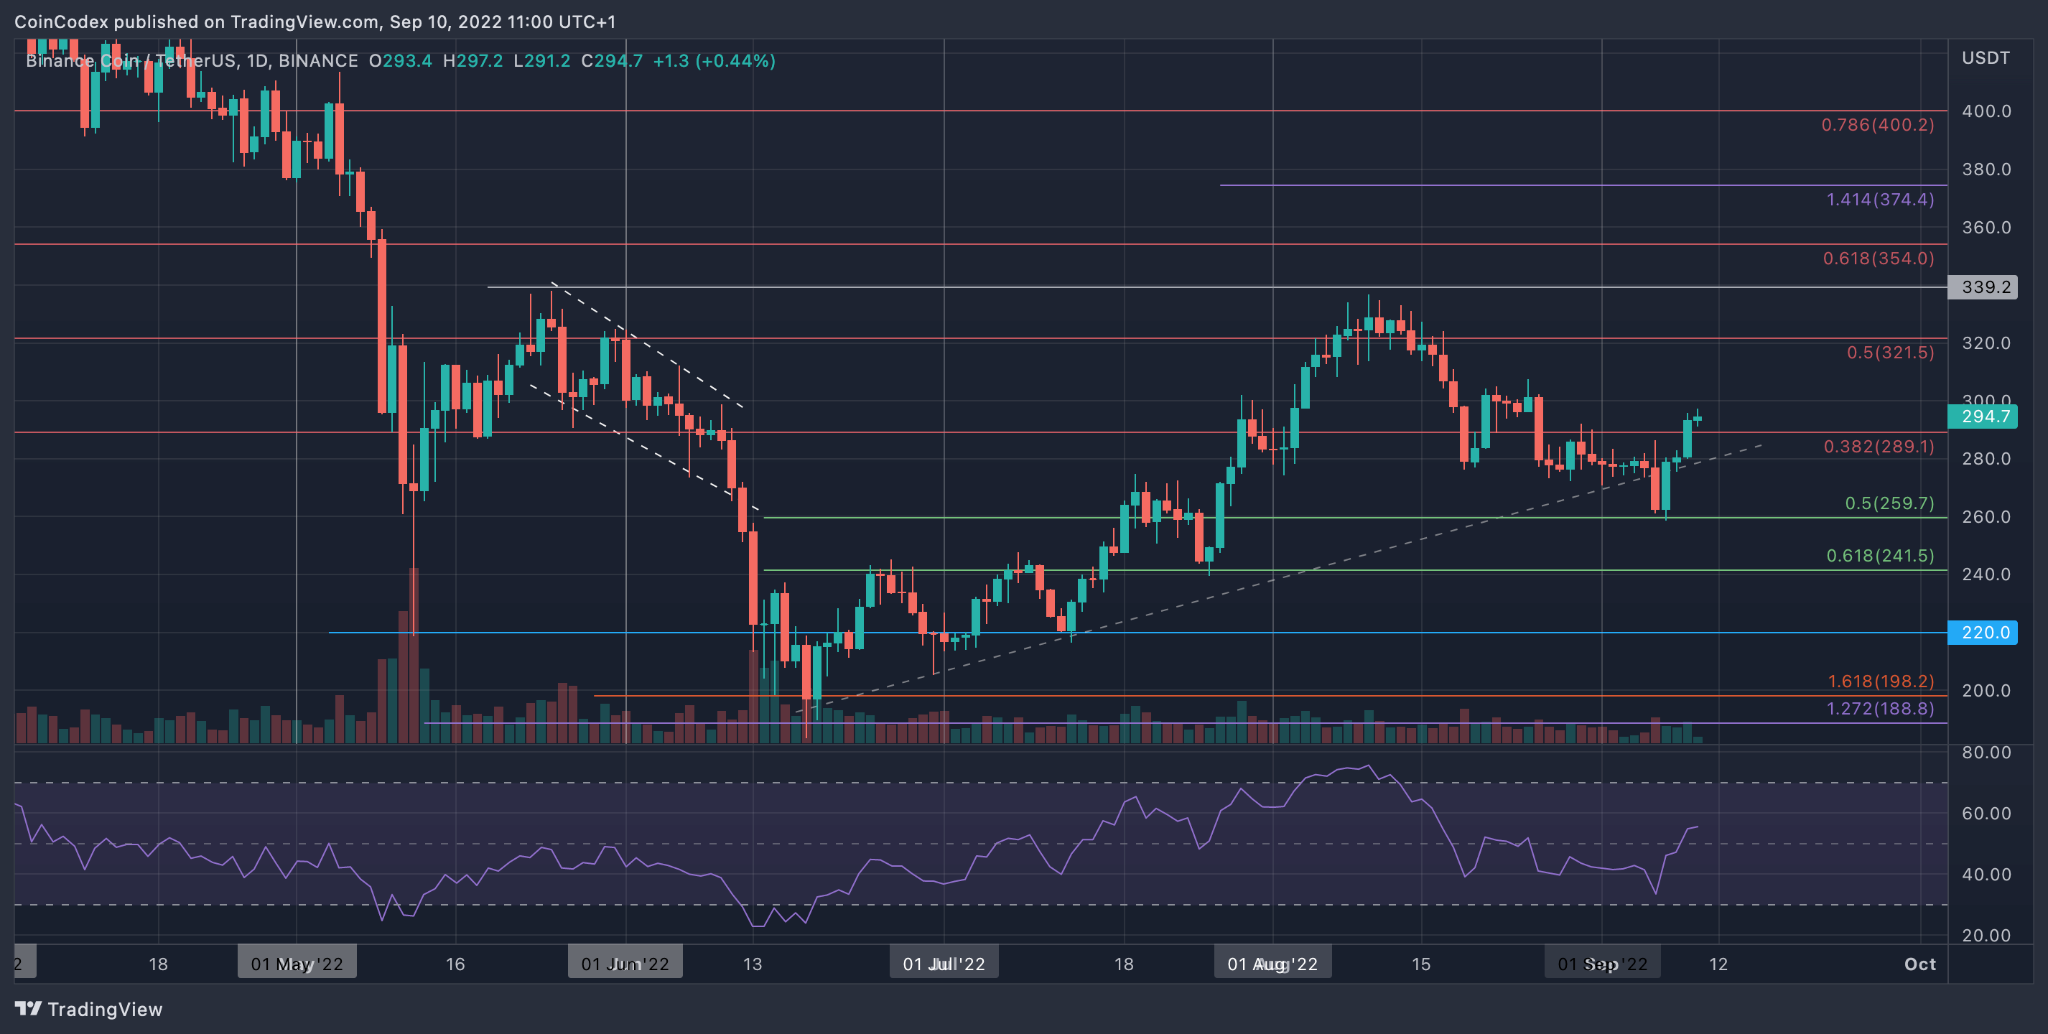
Short-term trend: Bullish above $340
BNB would need to break $340 to turn bullish again. A break beneath the $260 support could turn the market bearish.
Looking ahead, the first resistance lies at $300. This is followed by resistance at $320 (bearish .5 Fib), $340, $355 (bearish .618 Fib), and $375 (1.414 Fib Extension).
On the other side, the first support lies at $280. This is followed by $260, $250, $241, and $220.