QNT price action shows a bullish reversal rally from the $87 support level, accounting for a jump of 8.5% in the last 48 hours. The QNT prices avoided a drop below the $87 support level, with lower price rejection leading to a bullish reversal of 8.5% within the last 48 hours. Moreover, the technical indicators support the possibility of an uptrend that may exceed the psychological mark of $100. However, the analysis warns of a bearish future if this bullish reversal fails.
Key Points:
- The QNT price action shows a bullish growth of 8.5%.
- However, the buyers will face opposition at the $112 level if they exceed the $100 mark.
- The intraday trading volume in Quant is $26.79 million.
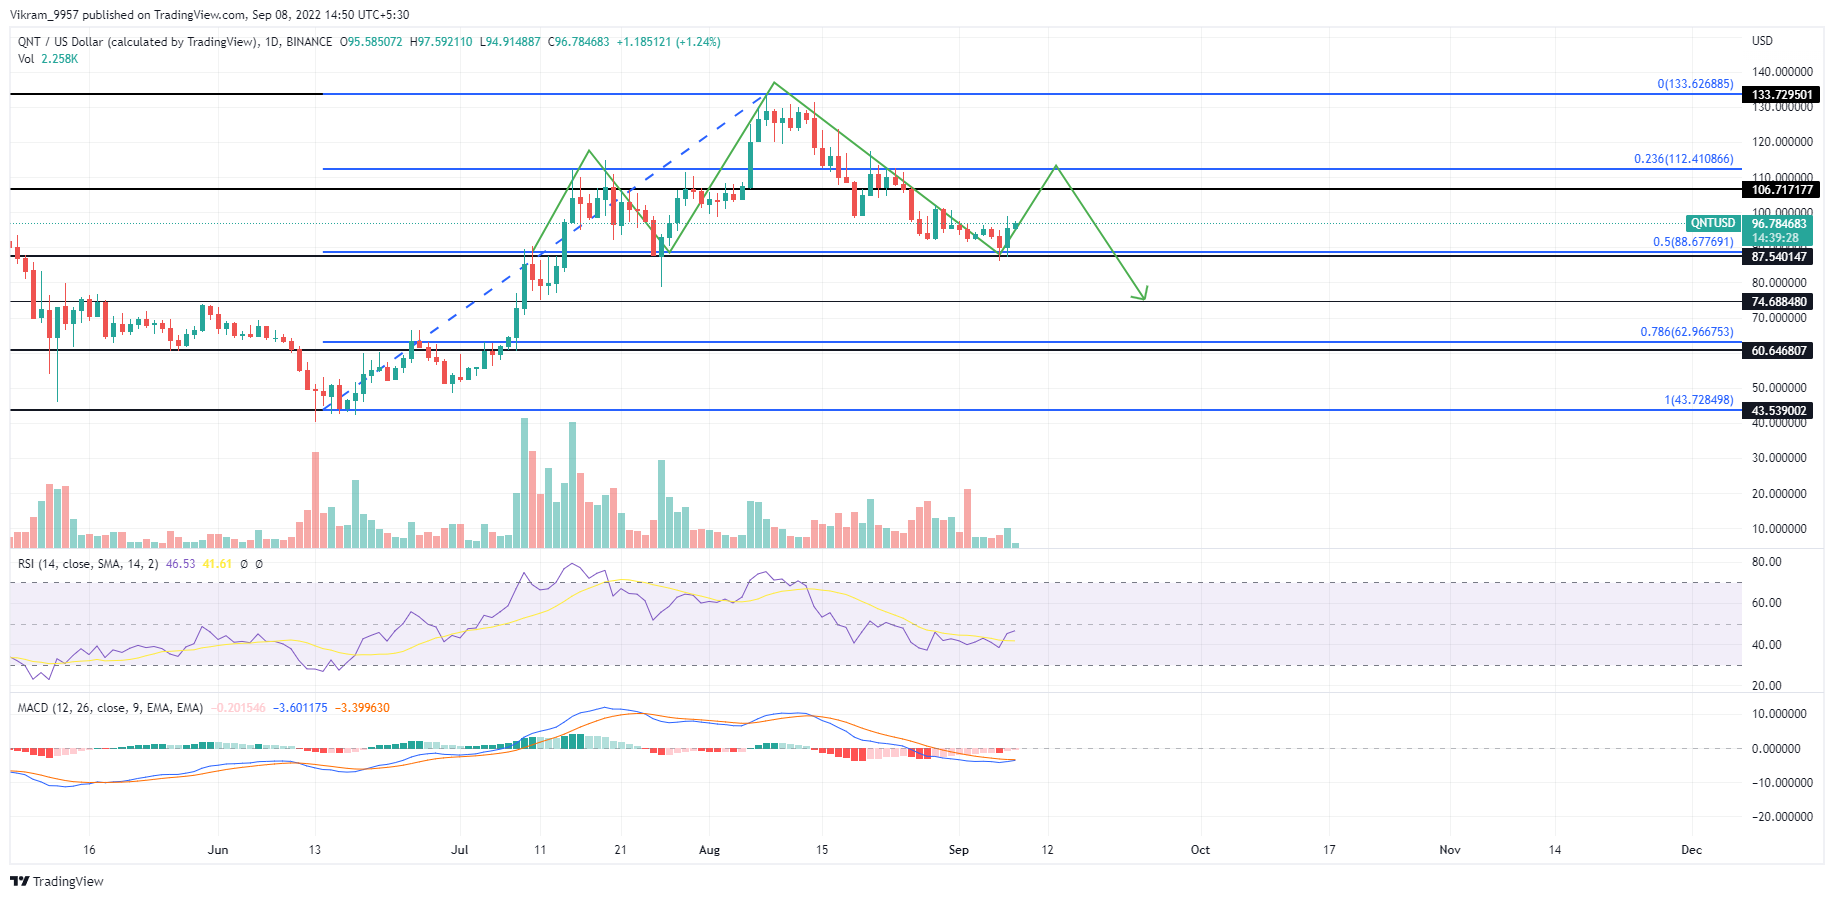 Source - TradingView
QNT Technical Analysis
After a downfall of 30% within three weeks, the QNT prices break below the $100 mark to take support at the $87 support level. However, with a lower price rejection in a bullish engulfing candle, the buyer regains trend control and restarts the bull cycle. The bullish reversal accounts for an 8.5% jump within the last 48 hours, projecting a high possibility of an uptrend continuation. However, if the buyers fail to exceed the $106 or $112 resistance level, the technical chart indicates the case of a head and shoulder pattern. With a neckline at $87, the bearish pattern will be complete if the sellers regain train control at dimension resistance levels to bring the prices back to the $87 mark. If the buyers exceed the $112 level, an uptrend to the swing high of $133 is possible. Otherwise, the sellers might complete the bearish pattern. Furthermore, if the Quant (QNT) prices fall below the $87 support level, the buyers will face difficulty stopping the downtrend before reaching the $75 mark.
Technical Indicators
Relative Strength Index: The daily-RSI slope maintains a lateral trend in the nearly oversold zone spike that exceeds a 14-day SMA and challenges the halfway line. MACD: The bullish crossover in the fast and slow lines may shortly restart the positive trend in the histograms. Hence the technical indicators support the bullish reversal and minimize the possibility of a head and shoulder pattern forming in the QNT price chart. Resistance Levels - $106 and $11 Support Levels - $87 and $75