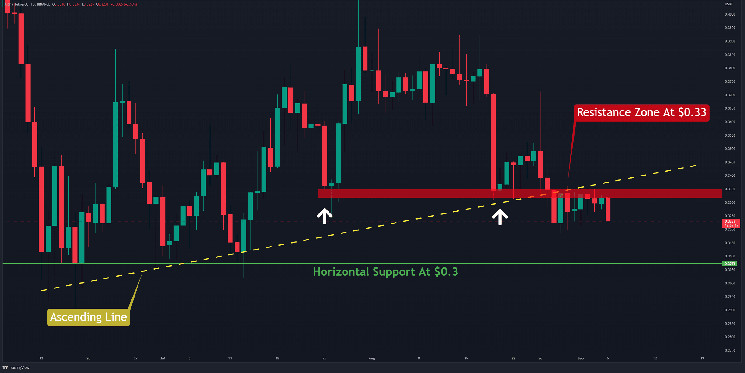
Ripple seems to be struggling around the support at $0.33 for 10 days in a row. As a result, the cryptocurrency is trading within a very narrow range with little to no volatility. The sentiment remains predominantly negative.
Technical Analysis
By Grizzly
The Daily Chart
On the daily chart, the bulls tried to extend the price above the resistance zone at $0.33 (in red) on multiple occasions. Presently, it appears that there’s not enough demand to propel a considerable increase.
The current structure formed after registering a high near $0.4 has been bearish. If this situation continues, the cryptocurrency is more likely to revisit the horizontal support at $0.3 (in green). The ascending line (in yellow) that has become resistance is another hurdle ahead of price growth.
Furthermore, this line currently overlaps with the red resistance zone, which gives more merit to bearish arguments. Until a candle closes above this area, an increase seems unlikely.
Key Support Levels: $0.32 & $0.30
Key Resistance Levels: $0.33 & $0.36
Daily Moving Averages:
MA20: $0.34
MA50: $0.35
MA100: $0.35
MA200: $0.51
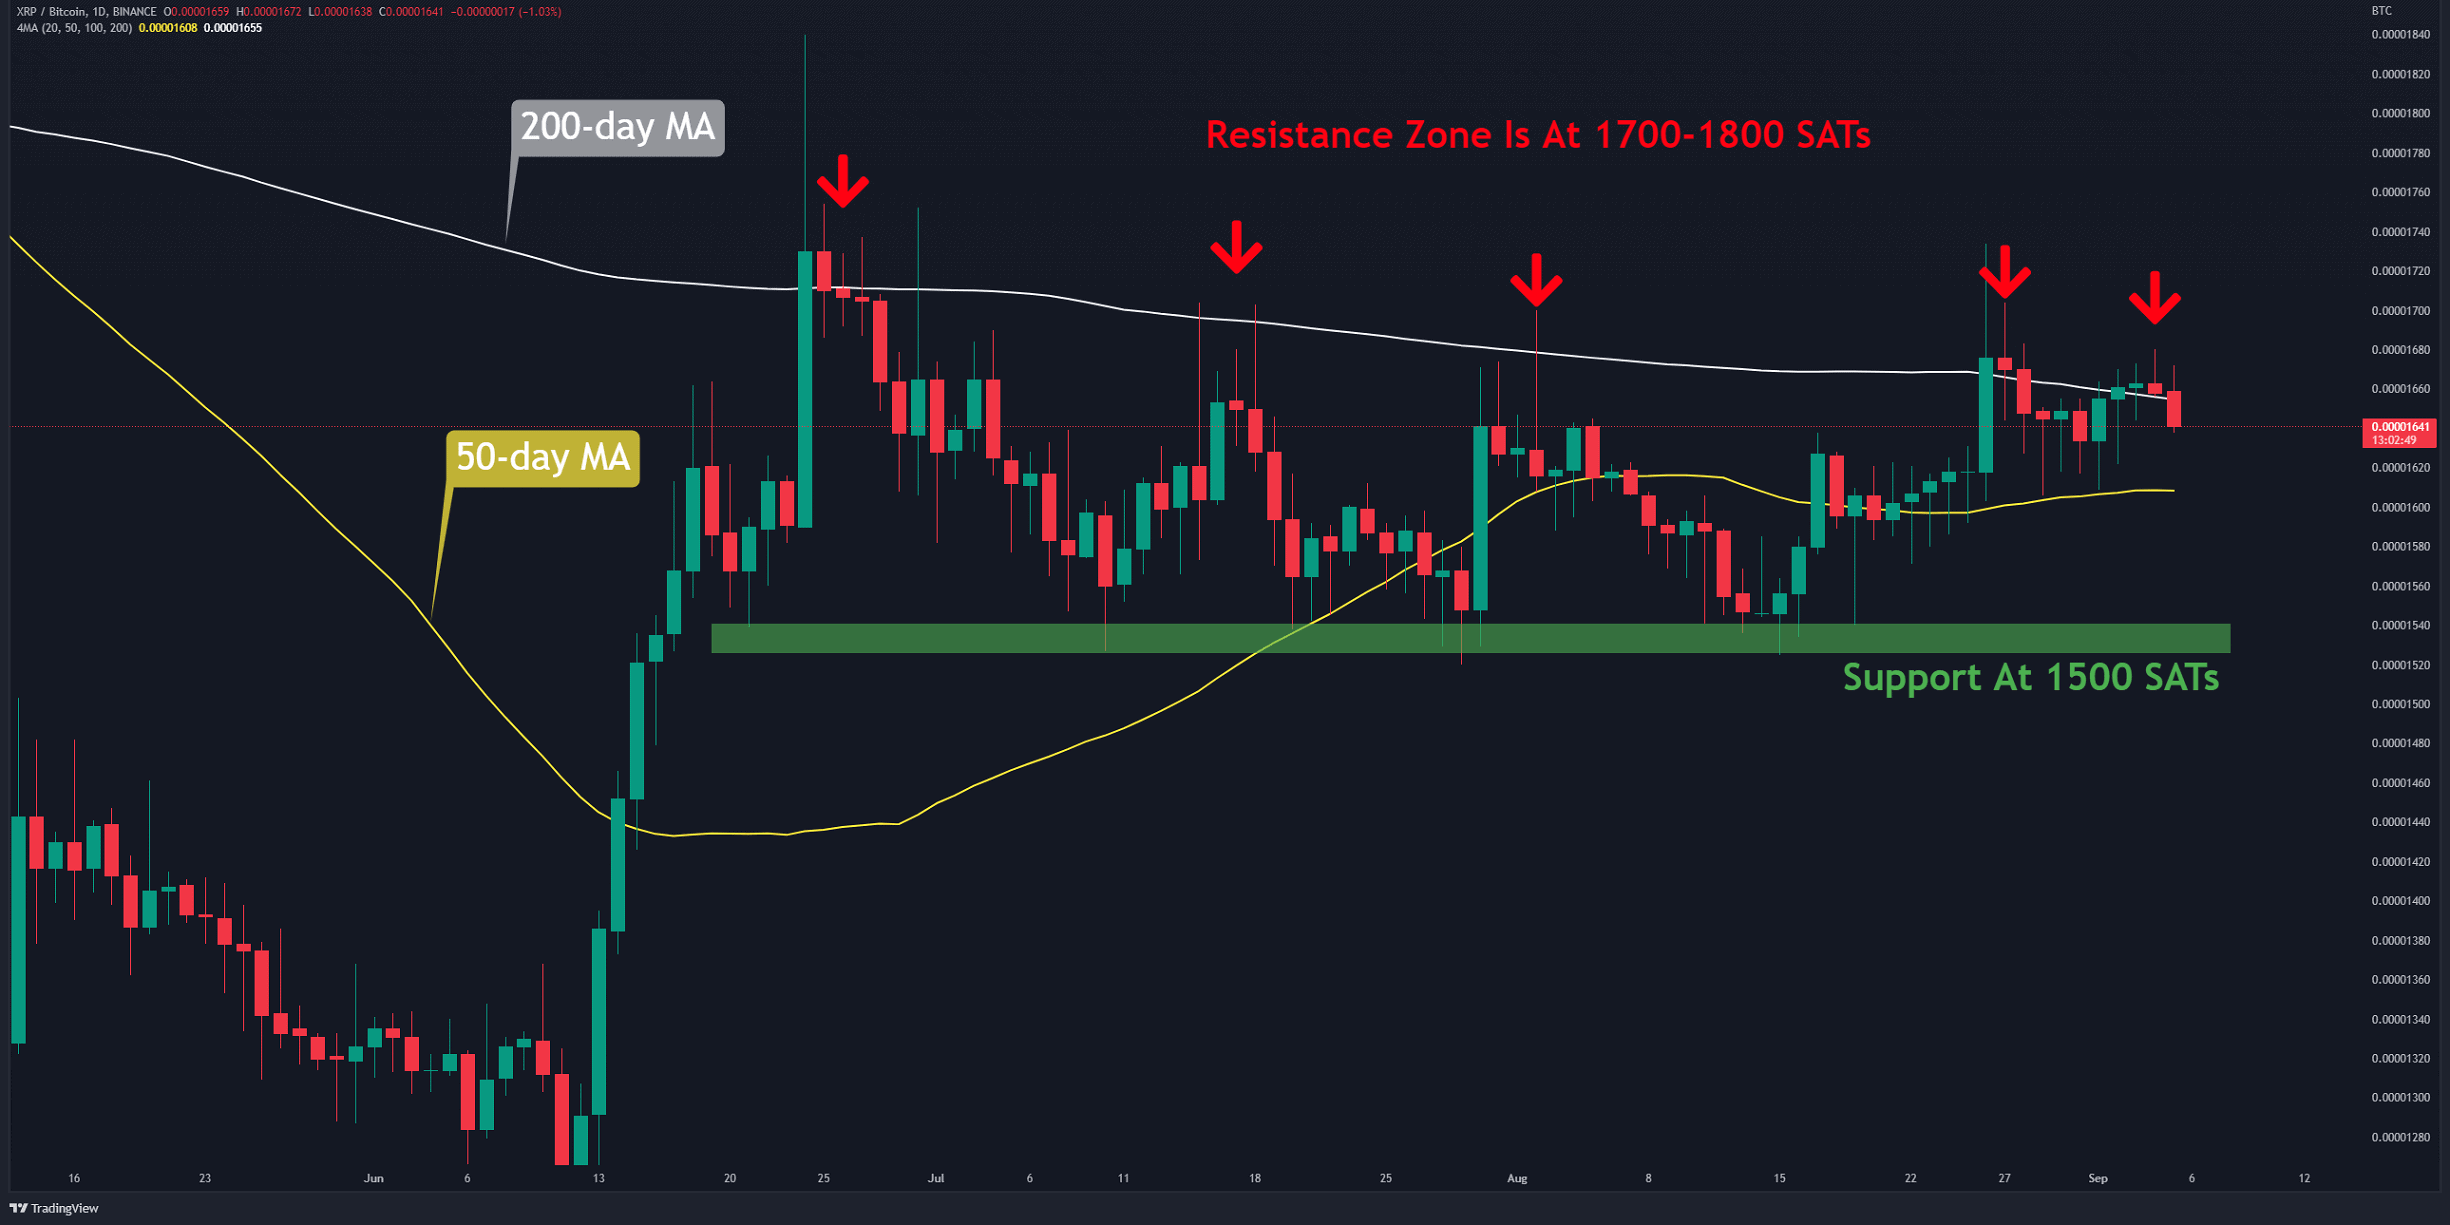
The XRP/BTC Chart
The bulls failed once again to break the 200-day moving average line (in white) on their fifth attempt. This resistance is in the range of 1700 SATs to 1800 SATs.
In the short term, the 50-day moving average (in yellow) acts as support. A close and break below it could send the pair to 1,500 SATs (in green).
Although the bulls have the upper hand in this particular chart, the start of a rally is ruled out until the price goes above 1800 SATs.
Key Support Levels: 1500 SATs & 1370 SATs
Key Resistance Levels: 1800 SATs & 2100 SATs