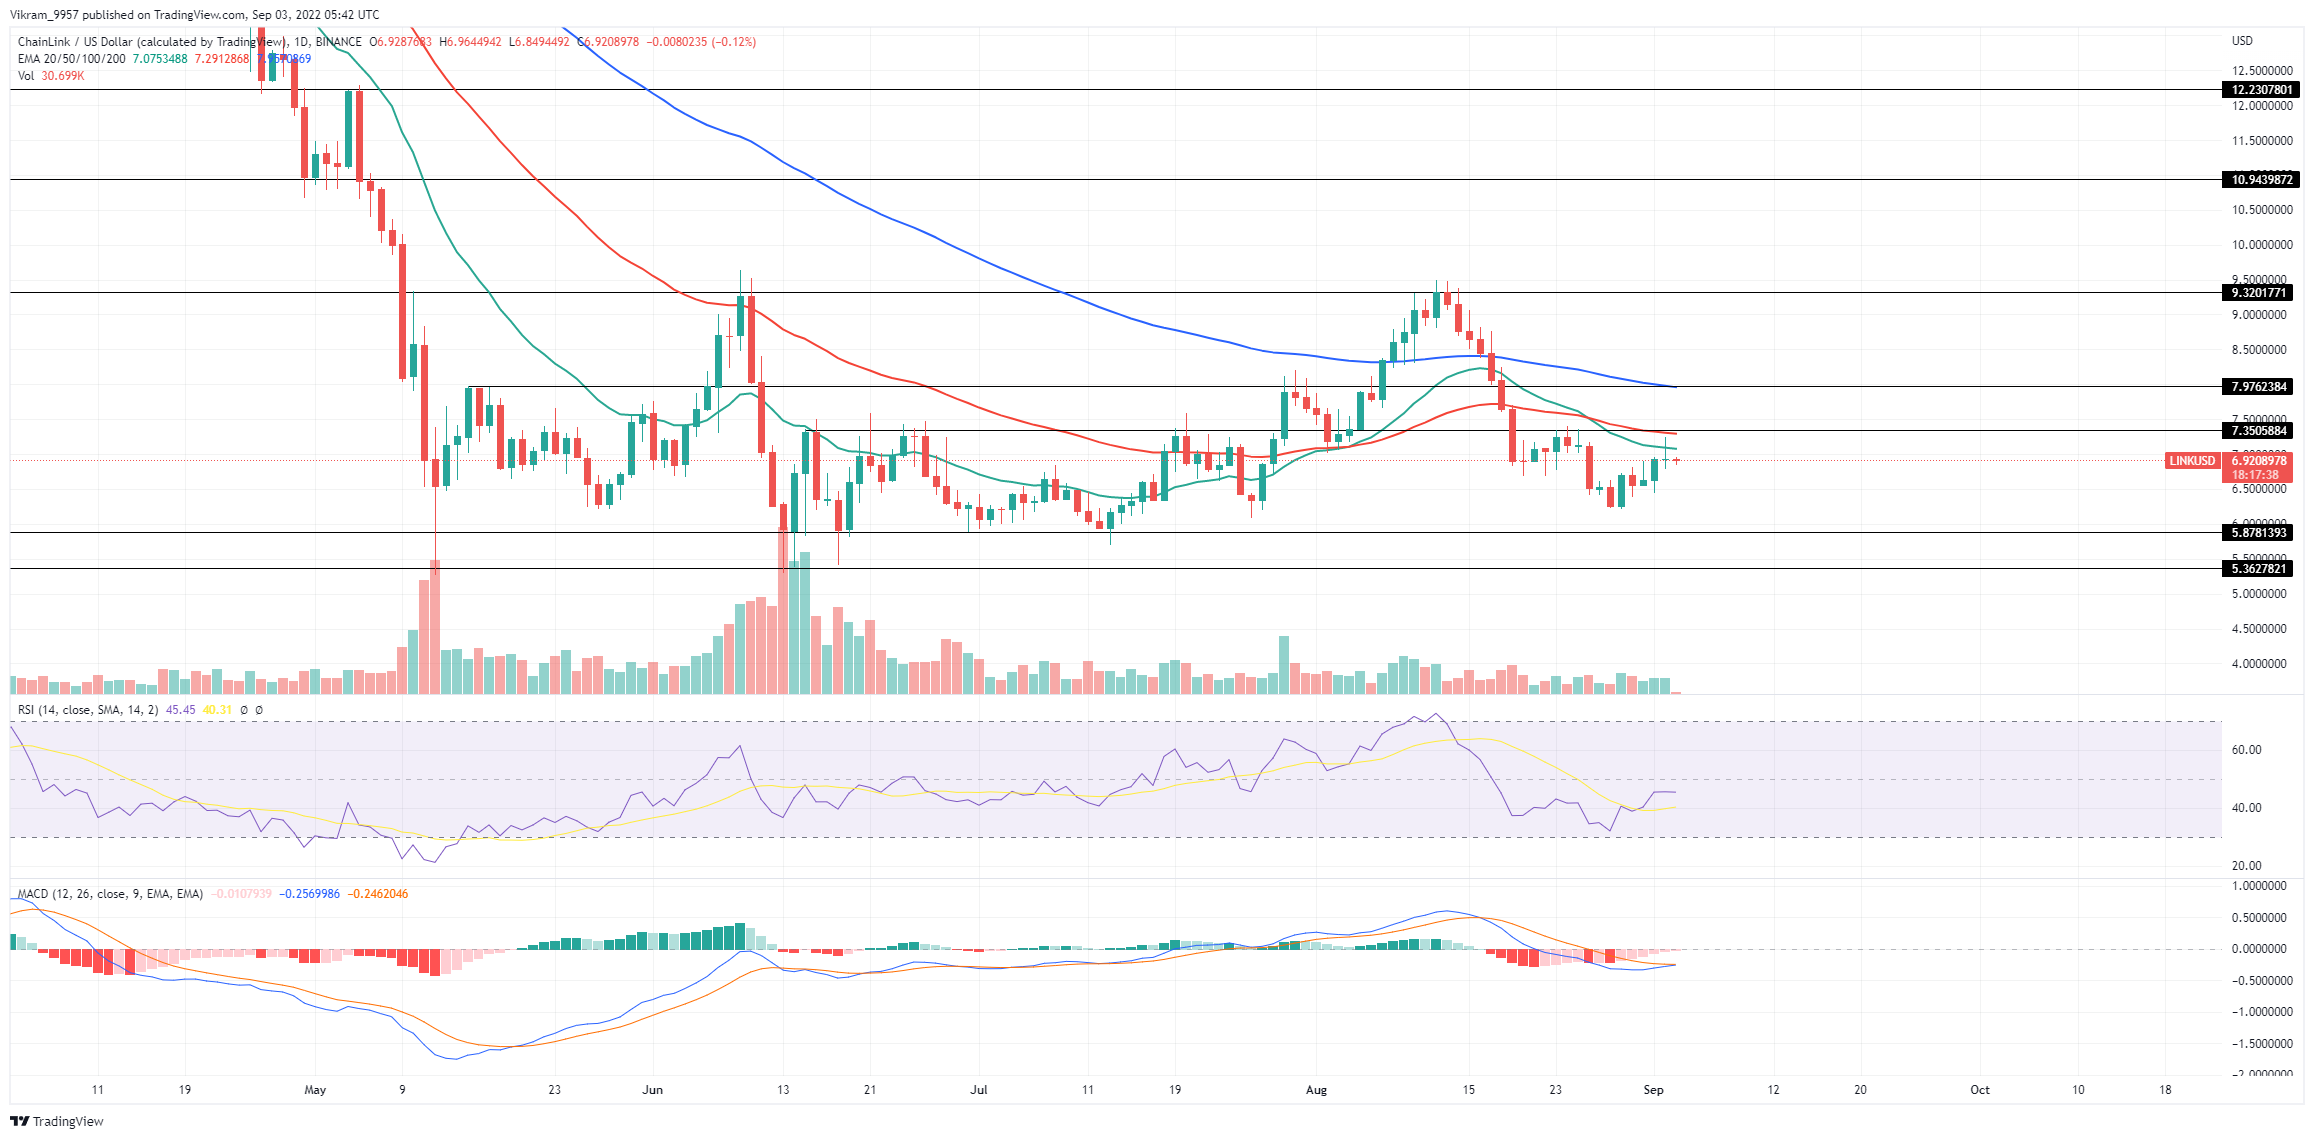
The LINK technical analysis shows a recovery rally struggling to rise above $7.35 and the 50-day SMA. Will this power struggle result in a breakout entry spot? Yesterday, the LINK prices displayed a higher price rejection candle at $7.3 resistance, hinting at the end of the ongoing relief rally. With a 0.8% drop today, the sellers bolster the possibility of price reversal. If the selling pressure persists, the holders may lose $6.3 support.
Key Points:
- The LINK chart shows high concentrated resistance at the $7.3 mark.
- The MACD indicator slope rising indicates the buyers are making recovery attempts, evidenced by the recent bullish crossover.
- The intraday trading volume in the LINK coin is $335.8 billion, showing a 14% gain.
 Source - Tradingview
LINK Technical Analysis
The LINK prices have been maintaining a lateral trend between $9.5 and $5.5 for about four months. Furthermore, the last reversal from the overhead resistance coincided with the widespread sell-off in the crypto market, tumbling by 34.5%. As a result, the downfall marked a new lower low at the crucial support of $6.25. The market price recovered 15% and hit the resistance zone at $7.3 over the past week. However, the long-wick candle indicates the sellers are wrestling with, resuming the prevailing correction. The LINK price could plunge below the $6.26 support level with sustained selling. Moreover, the bearish breakdown will intensify the selling pressure and could drop the price 12% lower to hit the May-June bottom support of $5.5. On a contrary note, if buyers manage to push prices higher, they should breach the $8 resistance to establish a genuine recovery opportunity. The LINK price could rechallenge the range top resistance of $9.5.
Technical Indicator
Amid the recent relief rally, the daily-RSI slope shows sustainability below the neutral line, indicating the market sentiment is a bearish and a bolstering continuation of price correction. Furthermore, the bullish crossover of the fast and slow lines in the MACD indicator with the bullish resurfacing histograms indicates growth in buying pressure. Hence, the technical indicators support the breakout possibility in the LINK prices. Resistance Levels: $7.35 and $8 Support Levels: $6.26 and $5.5
 cryptoknowmics.com