The cryptocurrency market fell back into bearish claws after several coins saw a dip in volume and market cap. The price crunch was a widespread phenomenon, affecting not just the top ten, but also other cryptocurrencies. At the time of writing, Tron was the biggest gainer in the top 10 club.
1 hour

Source: TradingView
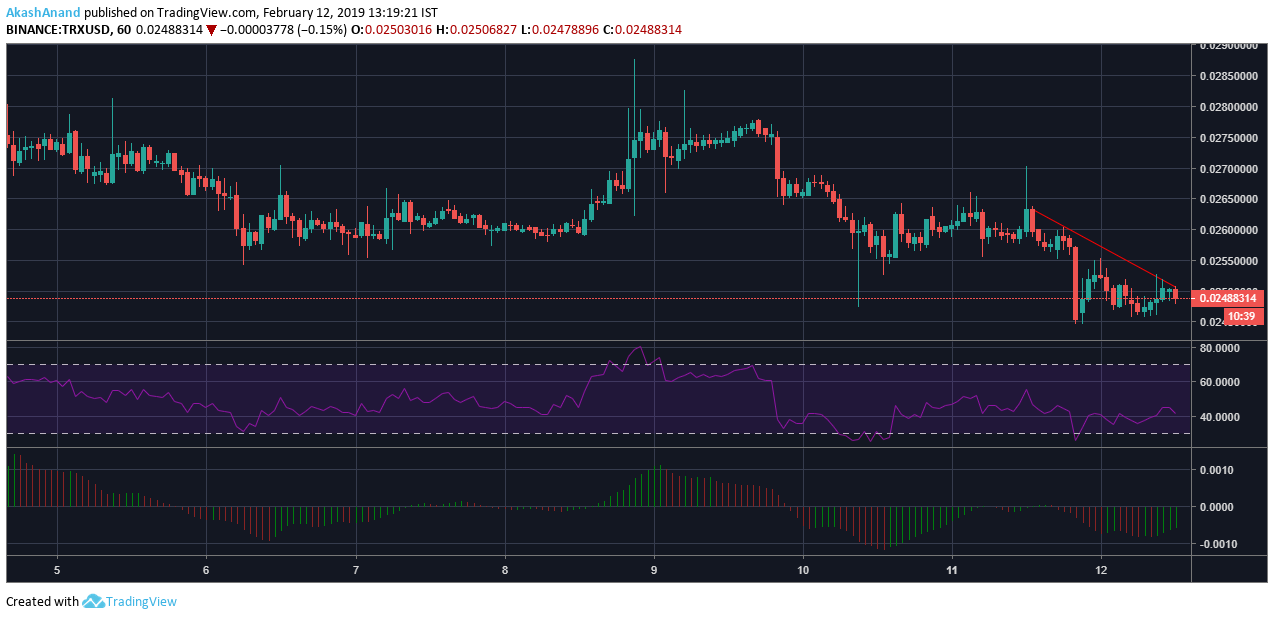
Tron’s one-hour graph showed a downtrend that was a result of the coin’s continued sideways movement. The downtrend caused Tron’s price to fall from $0.0243 to $0.0229. The support was at $0.22, while the resistance was holding at $0.0243.
The Bollinger Bands showed a divergence due to a sudden rise in the coin’s price. A lack of significant Bollinger clouds in the one-hour chart depicted minimal price breakouts.
The Chaikin Money Flow was below the zero line, suggesting that the capital leaving the market was more than the capital coming into the market.
The Awesome Oscillator spiked, suggesting an increase in Tron’s market momentum. This coincided with the coin’s rise in price.
1 day

Source: TradingView
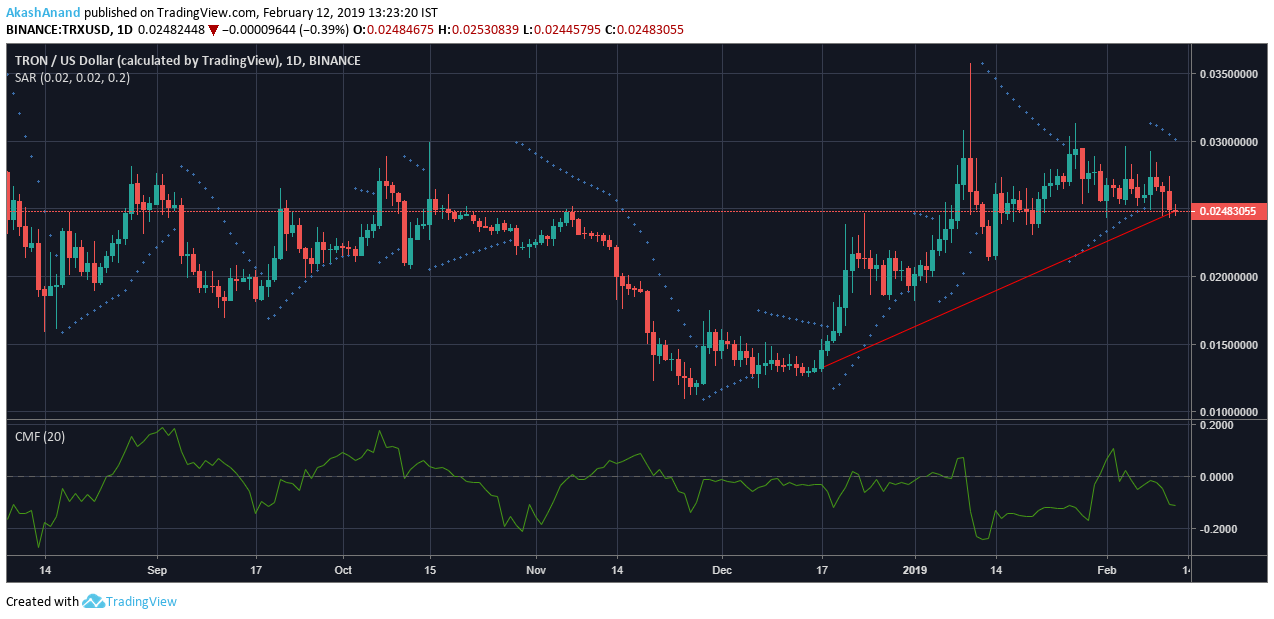
The one-day graph for Tron painted a completely different picture to that of the one-day graph, with the uptrend lifting the price from $0.0128 to $0.0224. The long term support was holding at $0.0119.
The Parabolic SAR markers were above the price candles, suggesting that Tron was projecting bearish signals in the long term.
The Relative Strength Index was closer to the oversold zone than the overbought zone, a sign of the selling pressure being more than the buying pressure.
The MACD indicator was moving in a conjoined manner, with the signal line and the MACD line staying below the histogram. The histogram was a mix of bearish and bullish signals.
Conclusion
Despite the long term uptrend, the above-mentioned indicators predicted that Tron’s bearish qualms will continue for an extended period of time.
 ambcrypto.com