Let’s study how the trading strategies built using popular indicators performed in February 2019 in the XRP/BTC markets. Technical indicators help crypto traders to make a buy/sell decision, and these indicators help create powerful strategies.
Movement of XRP / BTC from 8th Feb to 8th March
XRP/BTC has been aimlessly bustling over the last month. It followed a downward trend with shock waves in the first half of the month. These surging downtrend are now slowly recovering. But there is a possibility that downtrend and slow recovery will get hit with the macro downtrends and traders might end up losing money. And trading strategies that identify and push sudden swing will help investors make good money.
Ichimoku Cloud
This strategy uses a versatile and robust indicator – Ichimoku cloud – to generate buy and sell signals. Ichimoku is a lagging indicator that capture macro trends, and useful in a variety of markets. There are multiple ways to read the indicator and get Buy/Sell signals. The Ichimoku Cloud easily analyses the macro downtrend, and avoids at longer time frames but fails miserably to make an alpha. It cannot be used to measure trends with small timeframes.
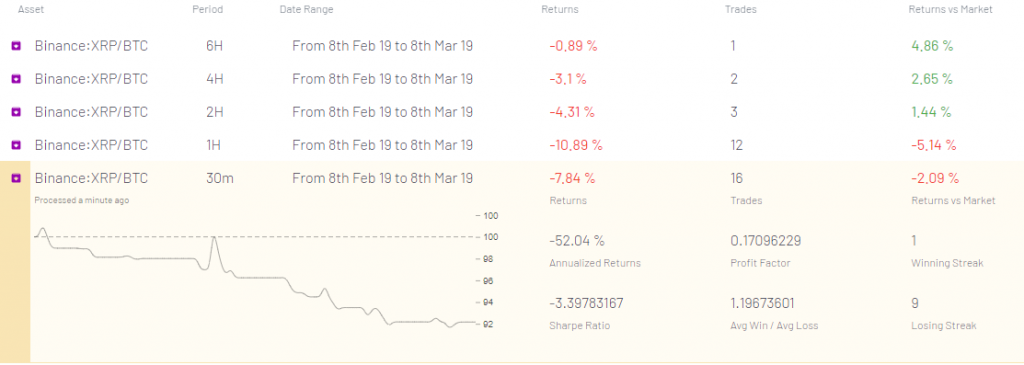
Ichimoku cloud strategy return over different time periods from 6th Feb to 6th March 2018 created on Mudrex.
Bollinger Bands Strategy
A popular strategy in trading world, Bollinger bands are used to identify entry and exit points for trade. It basically follows a hypothesis that the prices will always revert to the mean, so it works well in markets that are choppy tossing from one to the other. It can be used for shorter timeframes to analyze sudden moves.
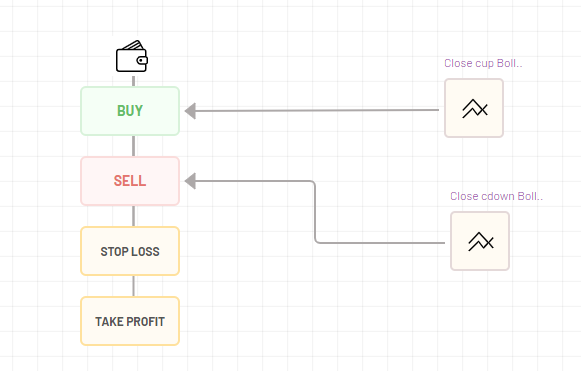
How the Bollinger band strategy is built on Mudrex with Stoploss/ Takeprofit
Directional Movement Indicator (DMI) with EMA
Directional movement indicator tries to identify trends in the market. When conjoined with EMA, they work well to identify strong upward and downward movements. This makes this wild combination very effective in bullish and bearish markets. However, when the trends are rough and fluctuating, DMI performs only moderately.
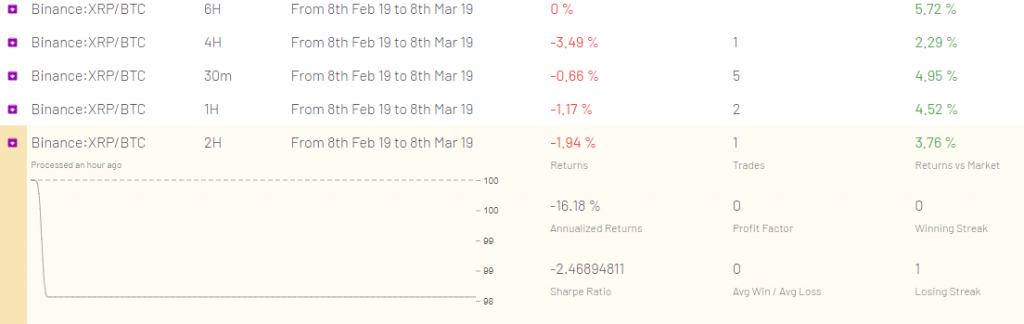
DMI strategy return over different time periods from 6th Feb to 6th March 2018. Created using Mudrex
As March is already here, the trend seems to weaken a bit but changes might occur. If the trend reversals happen quickly, then Ichimoku cloud strategy might perform well. XRP has historically always seen spikes and sudden upward and downward trends, thus following indicators like Bollinger bands might workout best.
You can check the above and more strategies out and test them at: https://mudrex.com/sample-strategies
Get the latest news on Blockchain only on Blockmanity.com. Subscribe to us on Google news and do follow us on Twitter @Blockmanity
Did you like the news you just read? Please leave a feedback to help us serve you better