Litecoin price analysis shows the LTC prices are currently showing some bullish momentum building up again after a brief period of consolidation in the $52-55 region. The prices have found some support near the $52 level and are currently trading around the $55.72mark. The current market scenario suggests that Litecoin may rise towards the $55.82 resistance level in the near term.
Litecoin price analysis shows that the digital asset has started gaining some momentum as the trading volume is increasing lately, which is currently at $546,013,473 and the total volume market cap is sitting at$3,961,379,704. Litecoin price analysis suggests that the digital asset is likely to continue its upward trend in the near term as long as it sustains above the $55.82 mark.
LTC/USD 1-day price chart: Bulls stumble to keep control
The daily chart for Litecoin price analysis shows that the cryptocurrency has been in a strong uptrend over the last 24 hours as it looks to continue its bullish momentum. The bears and bulls have been battling for control over the last few days as the prices have been consolidating in a narrow range. The bulls seem to be slowly gaining control as the prices have risen above the $55 mark.
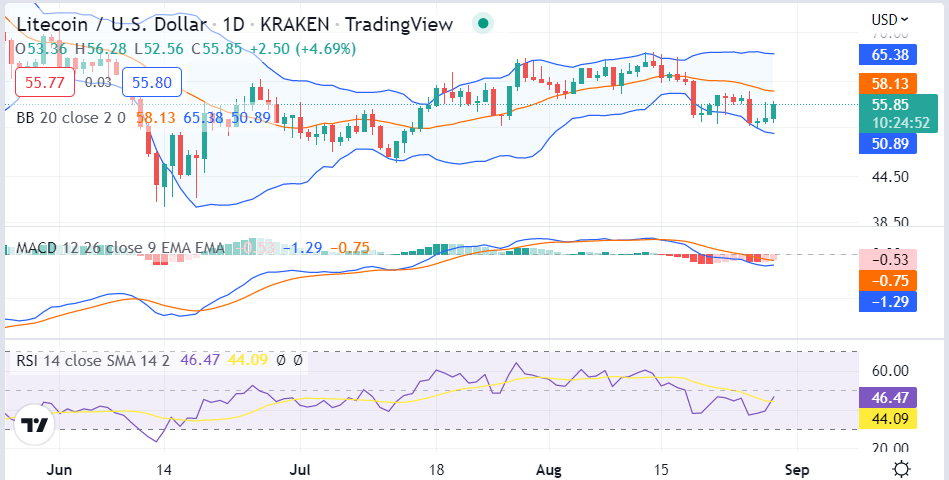
The Moving Average Convergence Divergence (MACD) on the 1-day timeframe is currently in the bullish zone as the MACD line (blue) is above the signal line (red) this indicates that Litecoin prices may rise further in the near term. The Bollinger band is currently in the overbought region as the prices have breached above the upper Bollinger band.
Litecoin price analysis 4-hour chart: Bulls stumble to keep control
The 4-hour Litecoin price analysis shows that the bulls have been struggling to keep control as the prices have breached below the $55 mark. The Moving average convergence divergence(MACD) on the 4-hour timeframe is currently moving above the signal line which indicates that Litecoin prices may continue to rise in the near term.
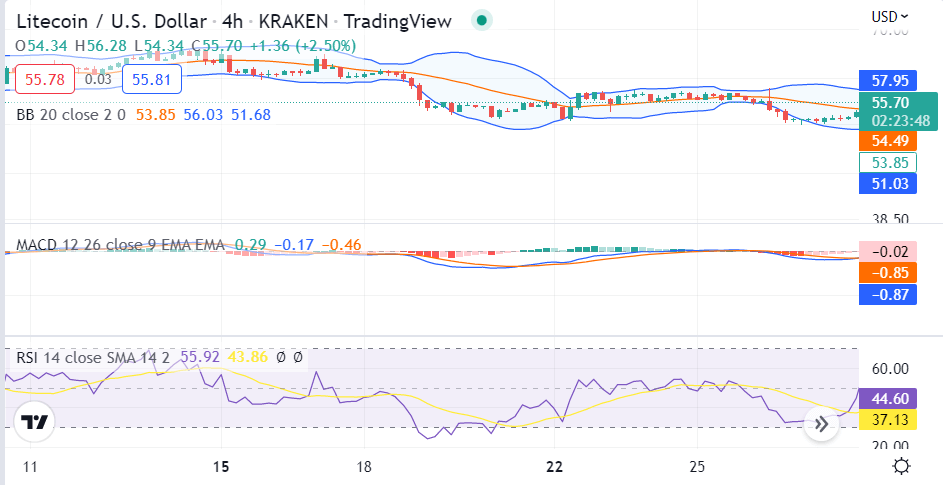
The RSI indicator is currently trading at 61.79, which is in the overbought region which shows that the price is in an upward trend. The Bollinger Bands on the 4-hour timeframe have expanded which indicates increased volatility in the market. The digital asset is currently trading near the upper Bollinger band, which indicates that Litecoin prices may fall in the near term.
Litecoin price analysis conclusion
To conclude, Litecoin price analysis shows that the bulls are in control of the market as the market is preparing to move higher as the bulls take control of the market. Most of the technical indications are in favor of the bulls as a bullish breakout is expected in the near term. The daily and hourly charts are indicating a bullish breakout which is likely to happen in the near term.
Disclaimer. The information provided is not trading advice. Cryptopolitan.com holds no liability for any investments made based on the information provided on this page. We strongly recommend independent research and/or consultation with a qualified professional before making any investment decisions.