Amp is a blockchain-based platform for facilitating highly secured asset transfers. By using collateral pools, AMP spreads the risk among various network participants. It is a decentralized, speedy, and tamper-proof ecosystem suitable for solving real-life problems. AMP is the utility token of this network. Let us look at the technical analysis of AMP.
Past Performance
On Jul 15, 2021, AMP opened at $0.05. On Jul 21, 2021, the price closed at $0.043. Thus, in the past week, the price has decreased by roughly 14%. In the last 24 hours, AMP has traded between $0.041-$0.045.
https://s3.tradingview.com/snapshots/j/j46gv8x2.png
Day-Ahead and Tomorrow
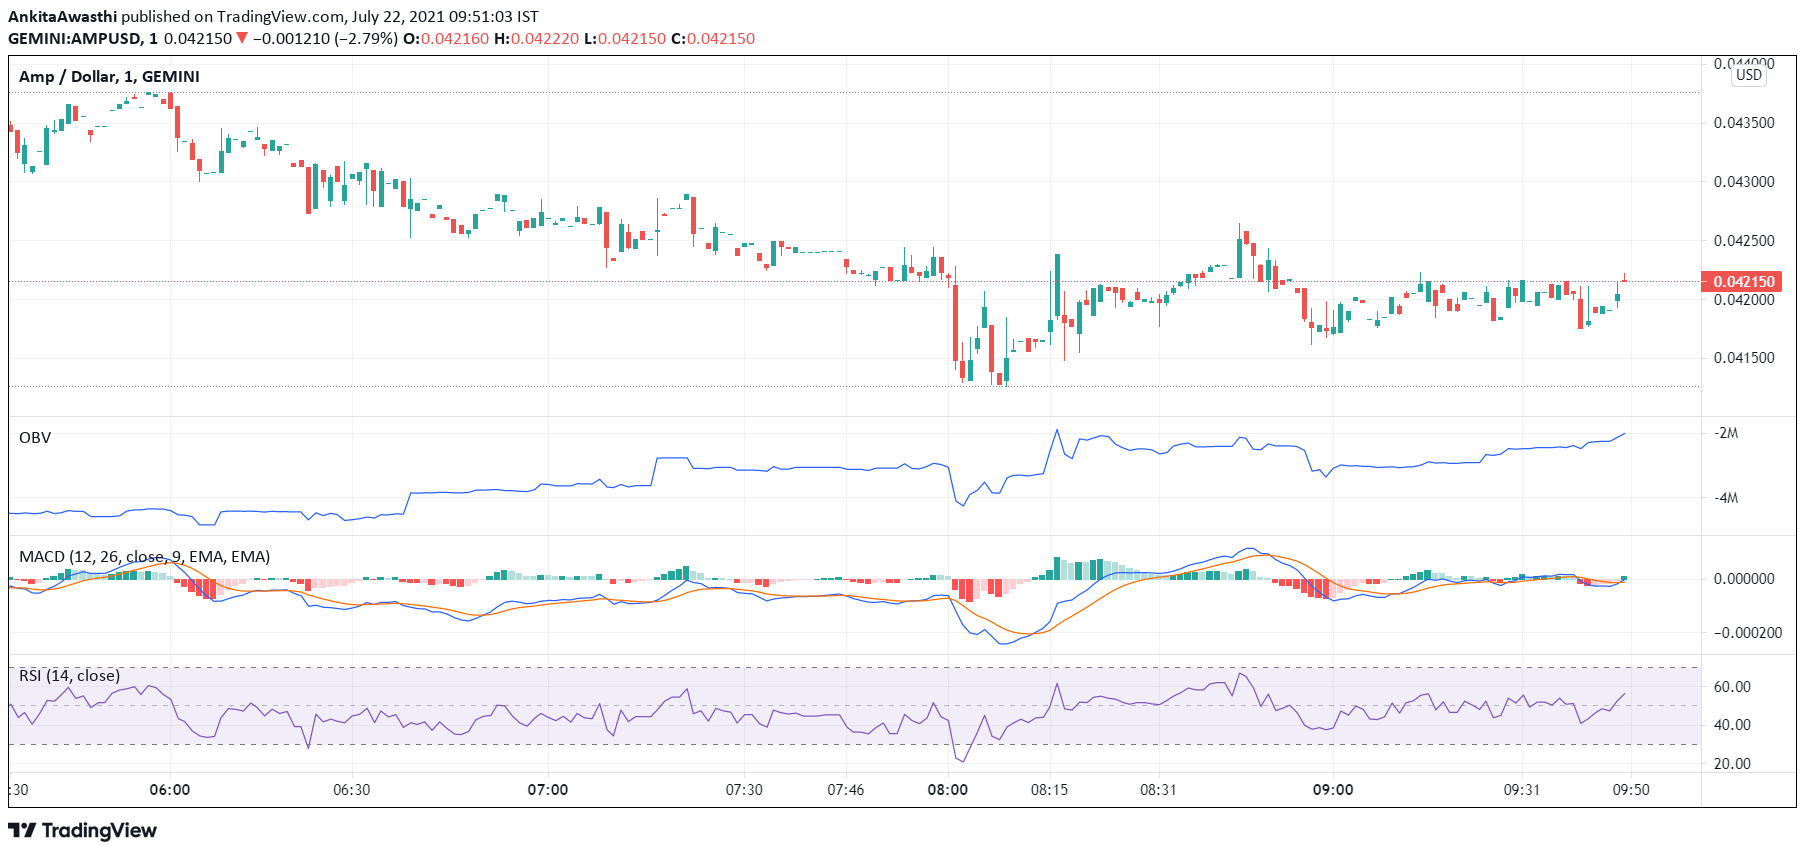
Currently, AMP is trading at $0.042. The price has decreased from the day’s opening price of $0.043. Thus, the market seems bearish.
The MACD and signal lines are turning positive. Moreover, a bullish crossover by the MACD line over the signal line has occurred. Thus, the overall market momentum is bullish. Hence, we can expect the price to start rising soon.
Currently, the RSI indicator is at 52%. It faced rejection at 49% and rose to the current level. Hence, buying pressures are high. High buying activity will exert upward pressure on the price.
However, the OBV indicator is upward sloping. Thus, buying volumes are higher than selling volumes. Hence, the price may start increasing. In short, all three oscillators have given bullish signals.
AMP Technical Analysis
Currently, the price is above the first Fibonacci pivot support level of $0.041. The price may soon break out of the Fibonacci pivot point of $0.043.
Currently, the price is above the 23.6% FIB retracement level of $0.0419. It may soon break out of the 38.2% FIB retracement level of $0.0425. If the price breaches the 76.4% FIB retracement level of $0.044 by day end, then the price uptrend may be strong enough to sustain till tomorrow.