THETA technical analysis displays a reversal rally challenging the 100-day SMA to continue the recovery phase. Should you hop onto this breakout possibility? After a remarkable downfall last week, THETA prices regain bullish momentum close to the psychological mark of $1.0. Additionally, the recovery rally challenges the 100-day SMA bringing a breakout entry opportunity for sideline buyers. So, should you consider betting on the bullish breakout?
Key Points:
- The THETA price trend shows a bullish recovery of 10% over the last seven days.
- The 50 and 100-day SMAs maintain a bearish alignment to keep the bullish growth in check.
- With a market cap of $5.08 billion, the intraday trading volume of Theta Network has increased by 77% to reach $1.39 billion.
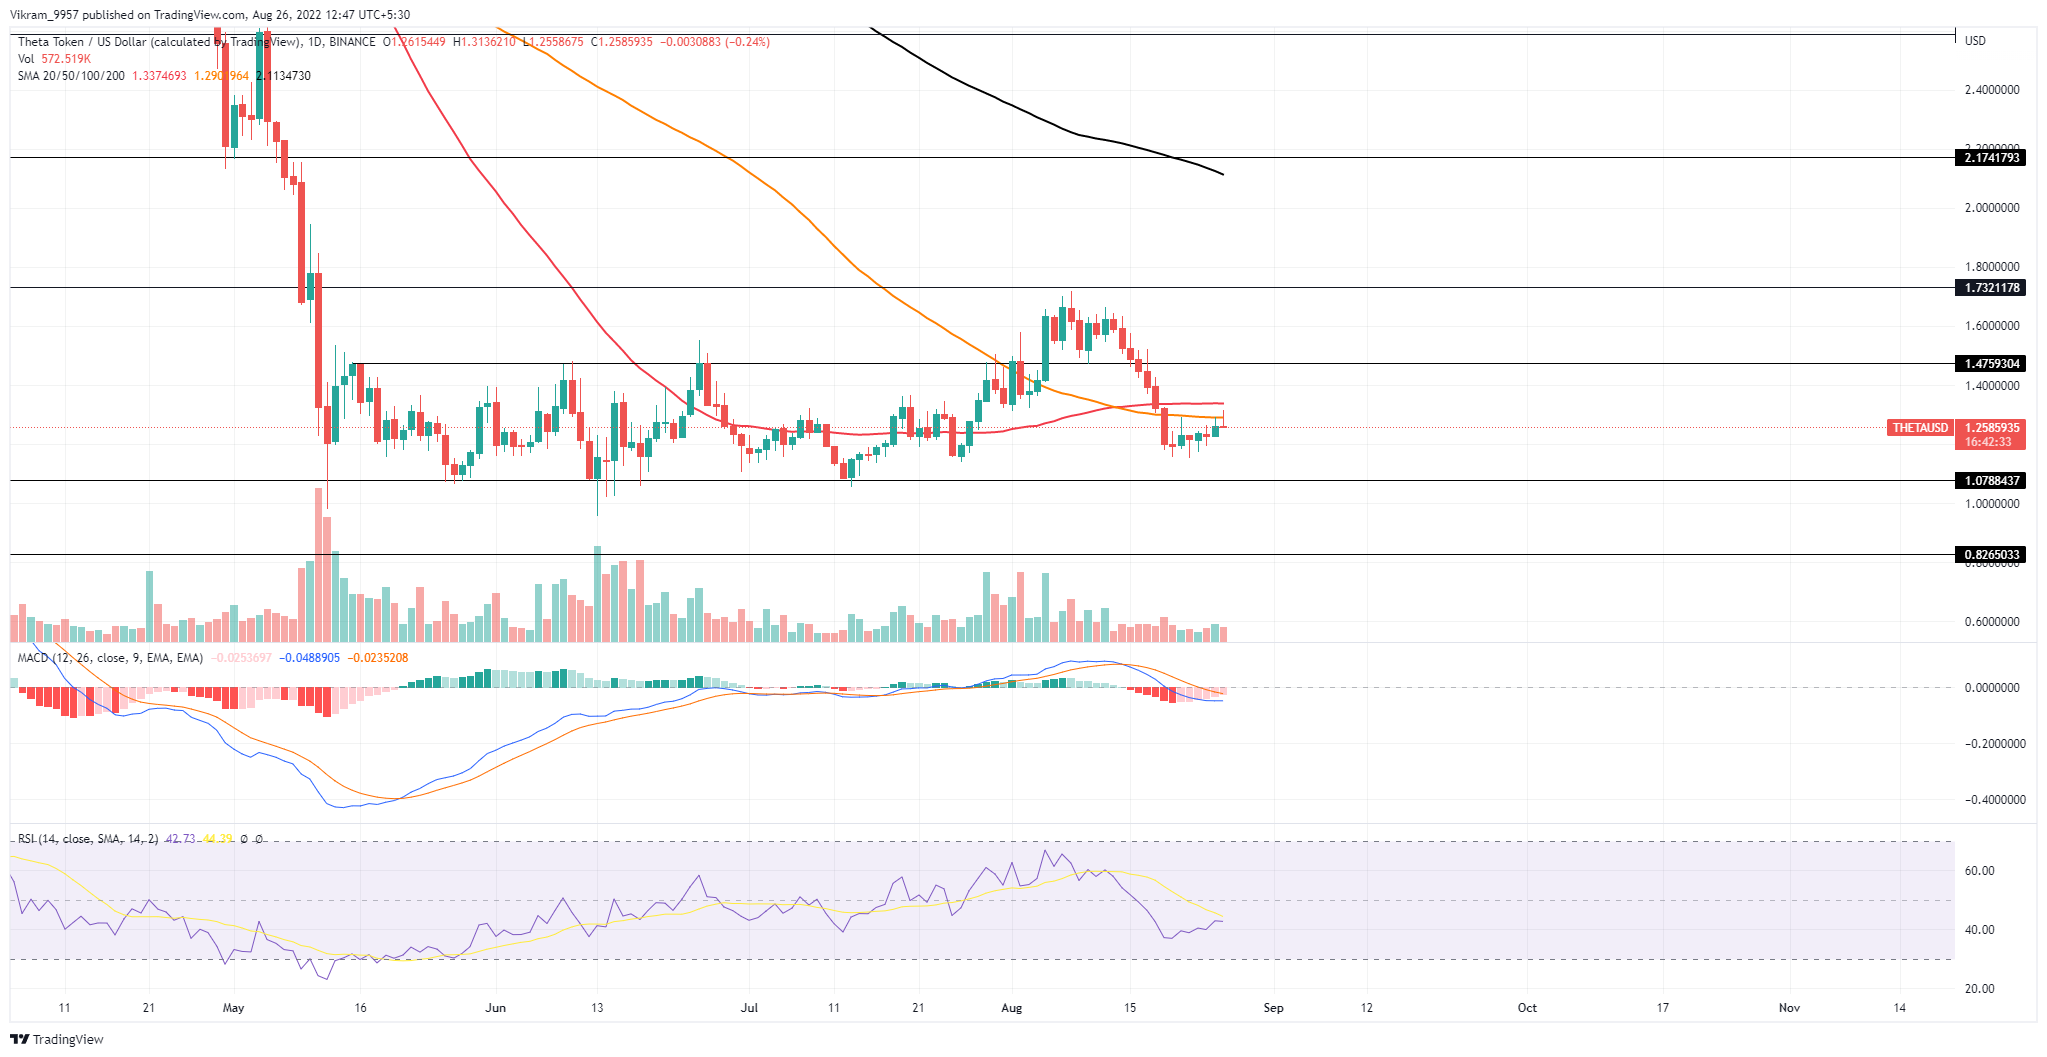 Source - Tradingview
THETA Technical Analysis
The THETA prices fall by 28% in the previous two weeks, dropping close to the psychological mark of $1.0. However, buyers avoid a drop to the crucial support with a Morning Star pattern and restart a bullish recovery rally. The recovery rally regains 10% of market value within the last seven days and approaches the $1.30 mark. But, the higher price rejection near the 50 and 100-day SMA projects the possibility of a bearish turnaround. If the selling persists at $1.3 resistance, the sellers will likely revert the prices 9% lower and offset this week's relief rally. The possible bearish reversal will rechallenge the $1.16 support, which is also the neckline of the head and shoulder pattern. Thus, a bearish breakout from the mentioned neckline will accelerate the selling momentum to break the June-July bottom support of $1. Alternatively, a bullish breakout from $1.3 will undermine the pattern formation and offer a recovery opportunity to $1.5.
Technical Indicators
The RSI slope struggling to surpass the 14-SMA into bearish territory accentuates that the sellers still possess the upper hand. Moreover, the fast and slow lines nosedived below the neutral line offered an extra edge for market sellers. However, the diminishing bearish trend in MACD histograms indicates an increase in buying pressure. Hence, the technical indicators represent a weakness in the underlying bearishness and increase the possibility of an uptrend in THETA prices. Resistance Levels: $1.50 and $2 Support Levels: $1 and $0.82