BAT technical analysis displays a lateral shift in trend after a sharp downfall last week. Will this range lead to a bullish reversal or a drop under $0.35? Last week, the 25% decline in BAT market value led to a sideways trend above the $0.35 support level. The lower price rejection candles tease an upside reversal, but the 100-day SMA proves a be a crucial resistance barrier. So, should you bet on a bullish reversal or avoid the possible trap?
Key Points:
- The BAT price chart shows a growing bearish influence over the daily chart.
- The 50 and 100-day SMAs maintain a sideways trend in a bearish alignment.
- With a market cap of $548 million, the intraday trading volume of Basic Attention Token has decreased by 5.14% to reach $36 million.
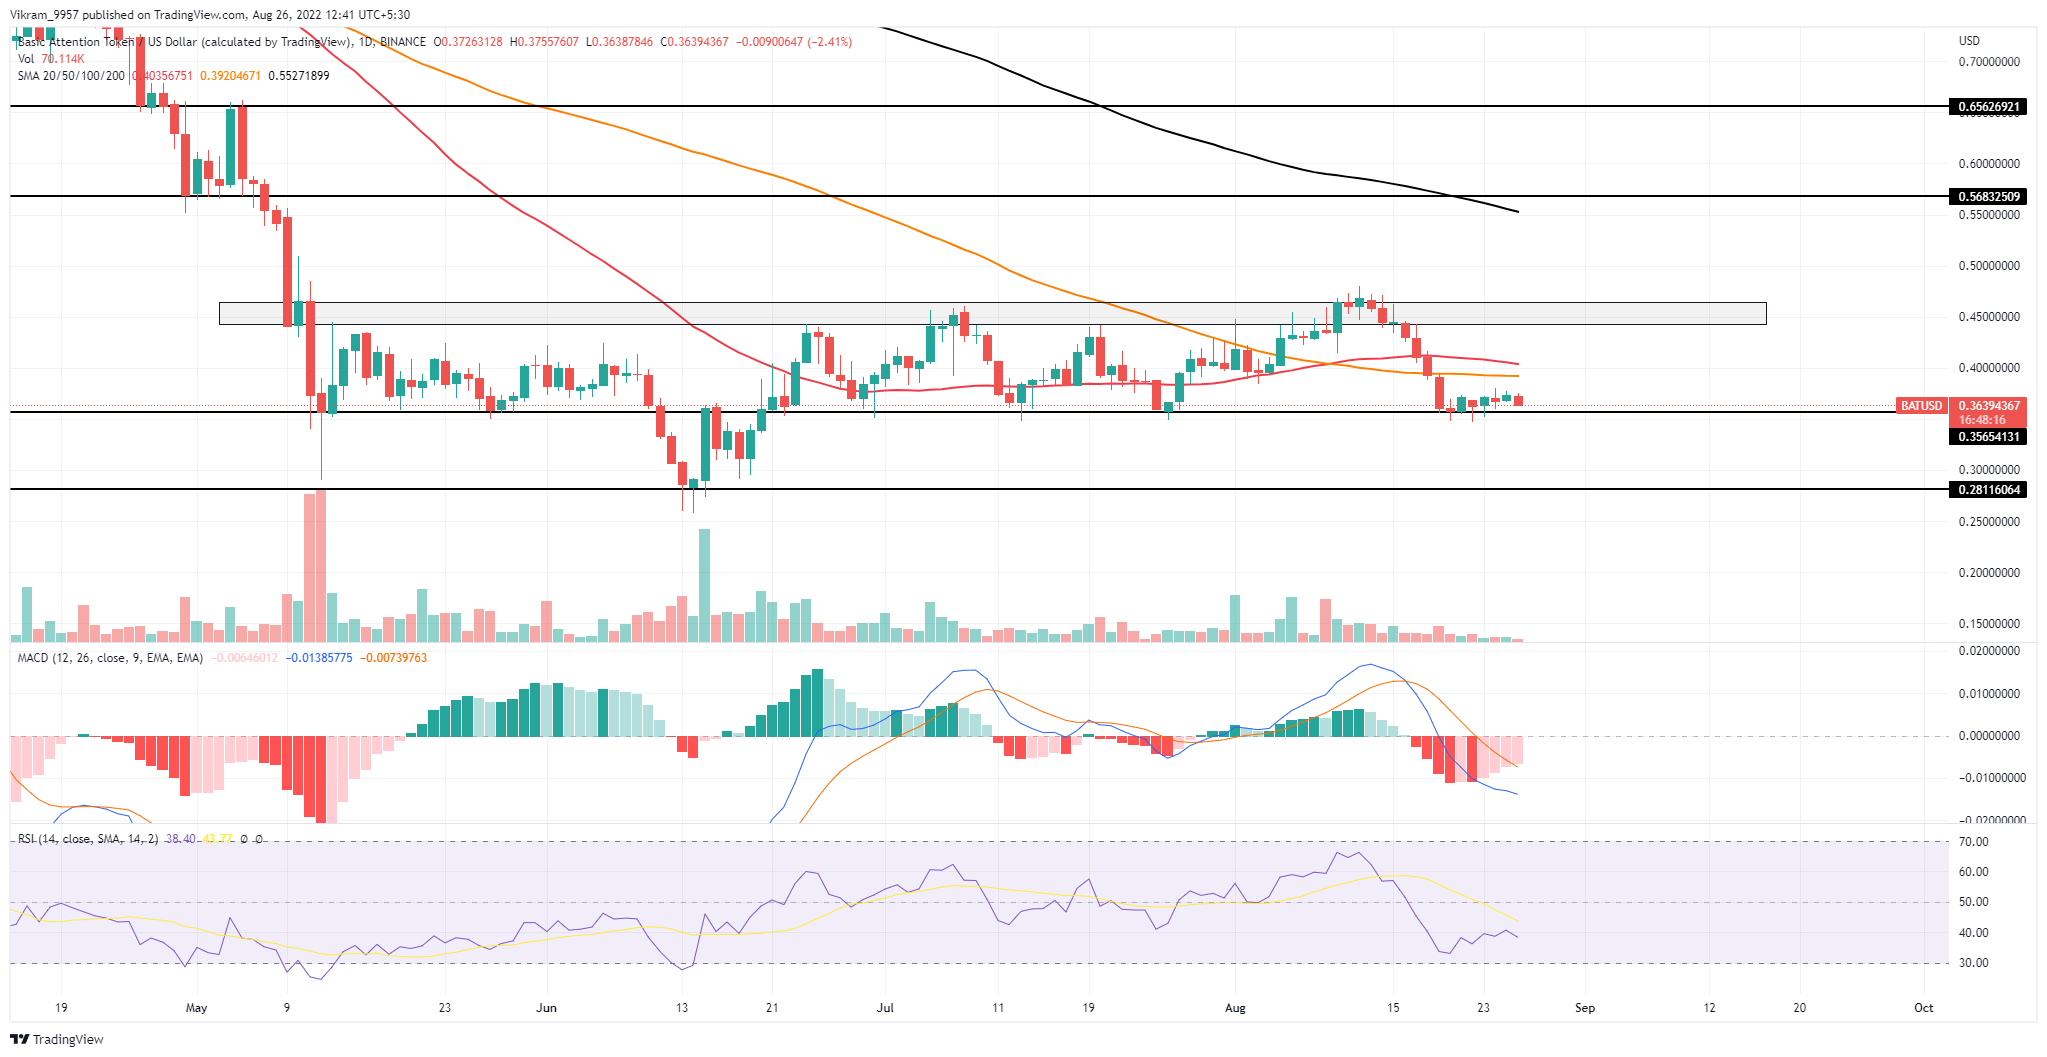 Source - Tradingview
BAT Technical Analysis
The bullish failure to cross the $0.45 supply zone resulted in a remarkable downfall in BAT market price. The declining trend deteriorated the market value by 25% within a week resulting in a drop to the $0.35 support level. However, the buyers questioned the falling prices with a Morning Star pattern leading to a sideways trend about the $0.35 support level. Moreover, the lack of meaningful activities in the trading volume during the low price rejection candles questions the bullish commitment. Meanwhile, the 50 and 100-day SMAs maintain a lateral trend in a bearish alignment slightly above the market price, providing overhead resistance. Despite the support of $0.35, the buyers struggling to drive the price higher indicate weakness in bullish momentum. Thus, a possible fallout of $0.35 will intensify the bearish momentum and plummet the prices by 25% to hit June low support at $0.26. On a contrary note, a bullish breakout from the immediate resistance of $0.38 will drive a bull cycle to $0.45 to continue the previous consolidation range.
Technical Indicators
The RSI slope losing momentum to climb higher indicates the sellers are wrestling for control. Moreover, the fast and slow lines maintain a significant gap of bearish alignment, indicating sustained selling pressure in the market. Hence the technical indicators represent a weakness in the underlying bearishness and increase the possibility of an uptrend in BAT prices. Resistance Levels: $0.38 and $0.45 Support Levels: $0.35 and $0.26