- On the daily price chart, the Kusama price is moving sharply downward and is trading below the consolidation phase at 2021 lows.
- KSM Crypto is trading below 20, 50, 100 and 200-days Daily Moving Average.
- The pair of KSM/BTC is at 0.002282 BTC with an intraday drop of 2.26%.
Kusama price is currently fighting to hold at the present level on the daily chart while trading with strong decline momentum. The cost of one KSM coin has remained constant between $55.00 to $70.00. Due to being caught by short sellers, the token is currently trading below the lower range of the consolidation phase. To avoid dropping significantly below the lower range of the consolidation period, KSM crypto must escape the grasp of short-sellers.
The Kusama price is now CMP at $48.61 after noticeably losing 2.88% of its market value over the previous 24 hours. The intraday trading session has seen a minor increase in trading volume of 1.53%. This shows that even though the token’s value is declining, it is still thriving to keep it at its current level. Volume to market cap ratio is 0.0569.
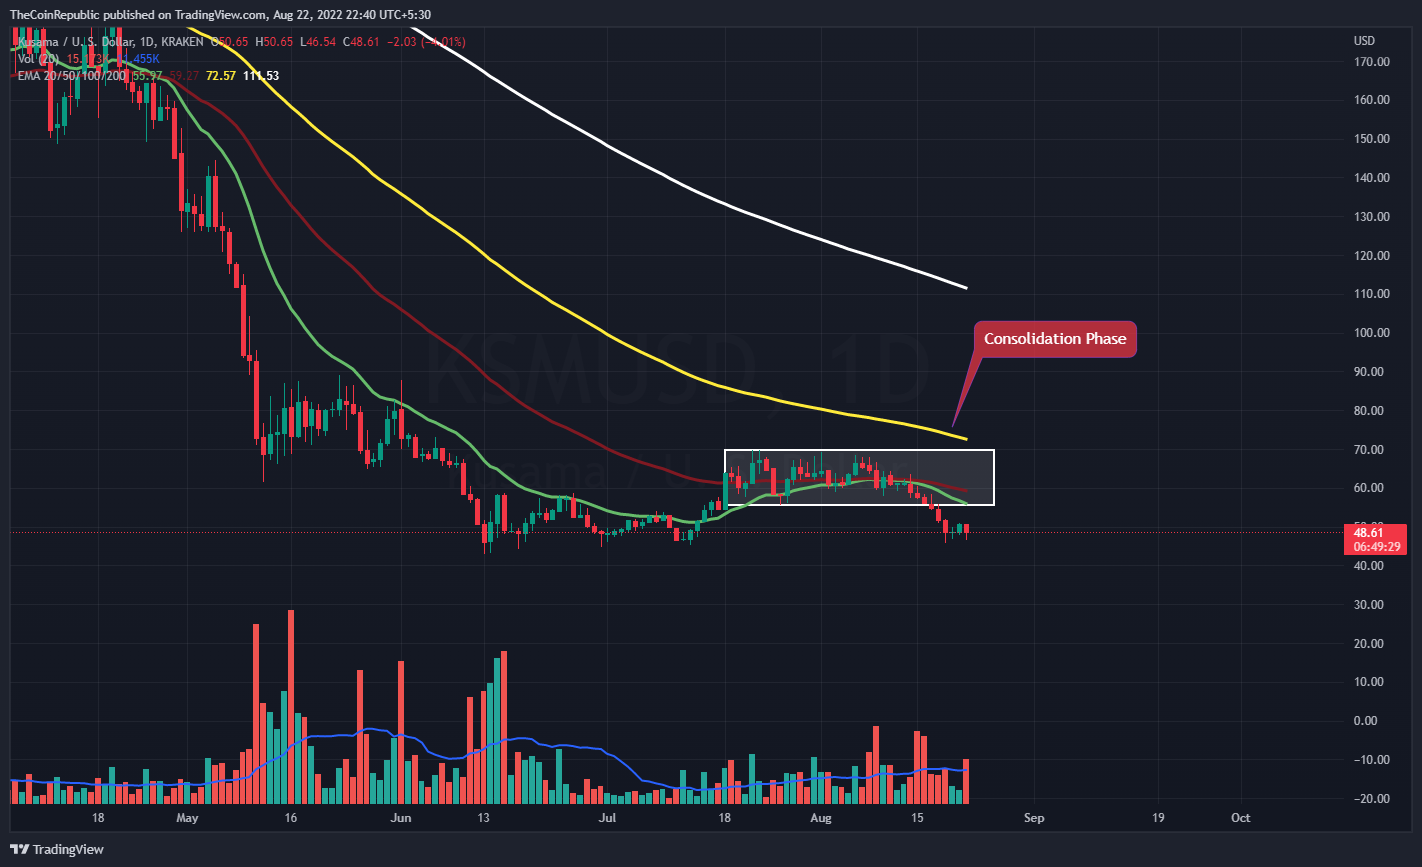
To stay above the consolidation phase, the price of the KSM coin must hold at this level. The volume bars demonstrate that the KSM currency market is now being dominated by bears. Because the volume change is still below normal, bulls must exert all of their muscle to limit volume and allow KSM to keep its position. Meanwhile, KSM Crypto is trading below 20, 50, 100 and 200-days Daily Moving Average.
KSM Bulls Must accumulate Themselves to Showcase Potential!
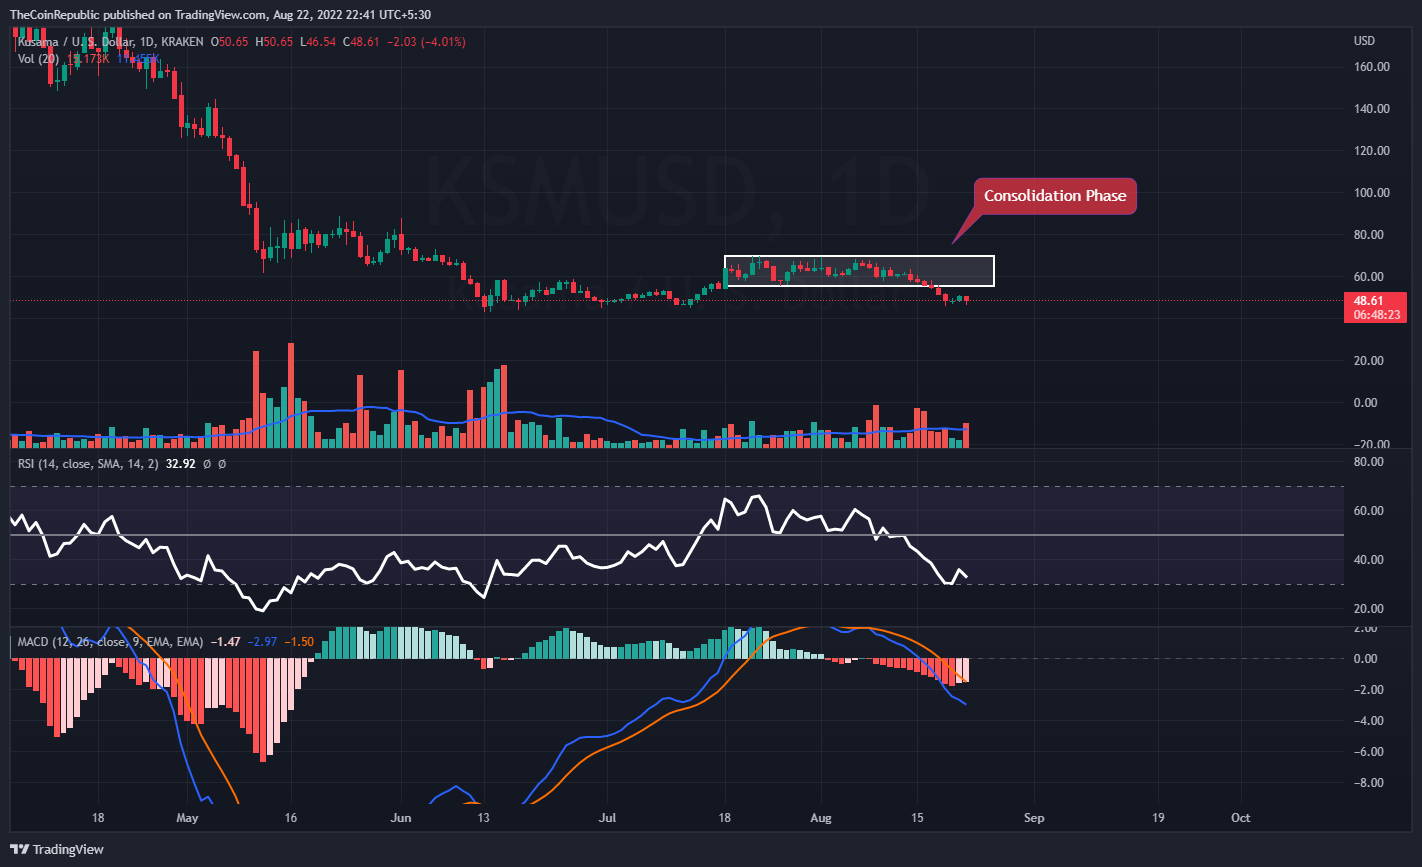
In order to avoid a large decline on the daily chart, the price of the KSM coin needs to remain above the lower price range of the consolidation phase. Technical indicators demonstrate the downward tendency of the KSM coin.
The relative strength index makes the downstream motion of the KSM coin crystal clear. The RSI, which is currently at 32, is about to go below the oversold area. The KSM coin’s decline momentum is displayed by the MACD. After a negative crossover, the MACD line is lower than the signal line. KSM investors must monitor the daily chart for any shifts in trend.
Conclusion
Kusama price is currently fighting to hold at the present level on the daily chart while trading with strong decline momentum. The cost of one KSM coin has remained constant between $55.00 to $70.00. Due to being caught by short sellers, the token is currently trading below the lower range of the consolidation phase. Because the volume change is still below normal, bulls must exert all of their muscle to limit volume and allow KSM to keep its position. Technical indicators demonstrate the downward tendency of the KSM coin. After a negative crossover, the MACD line is lower than the signal line. KSM investors must monitor the daily chart for any shifts in trend.
Technical Levels
Support Levels: $45.00 and $40.00
Resistance Levels: $55.00 and $60.00
Disclaimer
The views and opinions stated by the author, or any people named in this article, are for informational ideas only, and they do not establish the financial, investment, or other advice. Investing in or trading crypto assets comes with a risk of financial loss.