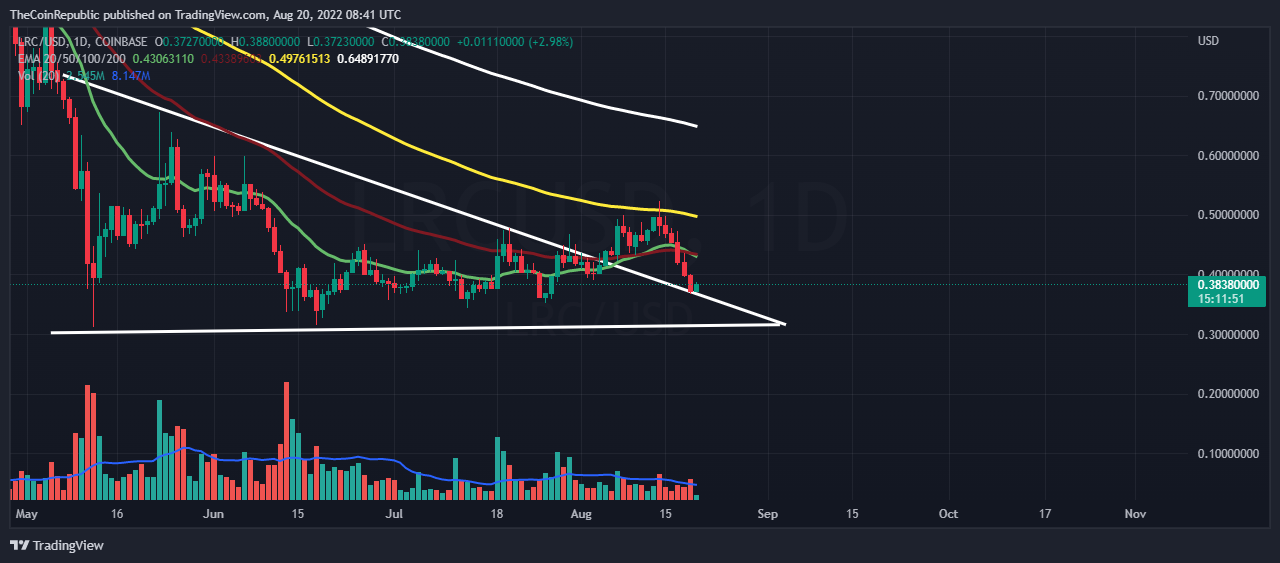
- The price was decreasing once more under the bearish dominance over the daily price chart after reporting a breakout from the descending triangle.
- The crypto asset is moving below the 20, 50, 100, and 200 days moving average over the daily price chart.
- The LRC/BTC pair is at 0.00001806 BTC which is at a gain of 5.55%.
After registering a breakout from the descending triangle the price was falling again amid the bearish dominance over the daily price chart. Now the price has started recovering as the uplift was provided by the accumulation of the bulls. This accumulation is a result of recovery over the leader cryptocurrency, Bitcoin. The BTC price today hit a resistance level of $21,000 which is helping the rest of the altcoins to recover.
The LRC bulls should make some constant efforts over the token to make the recovery sustainable or else the bears will make the ecosystem collapse. This can create a difficult situation for the bulls to make the token recover back.
The current price for one LRC token is hovering at $0.383 which is at a gain of 2.47% in its market capitalization in the last 24 hrs. The token has a trading volume of 57 million which is at a significant loss of 14.47% in the 24 hrs trading session and has a market cap of 509 million. The volume market cap ratio is 0.1139.
What do Technical Indicators Suggest for LRC?
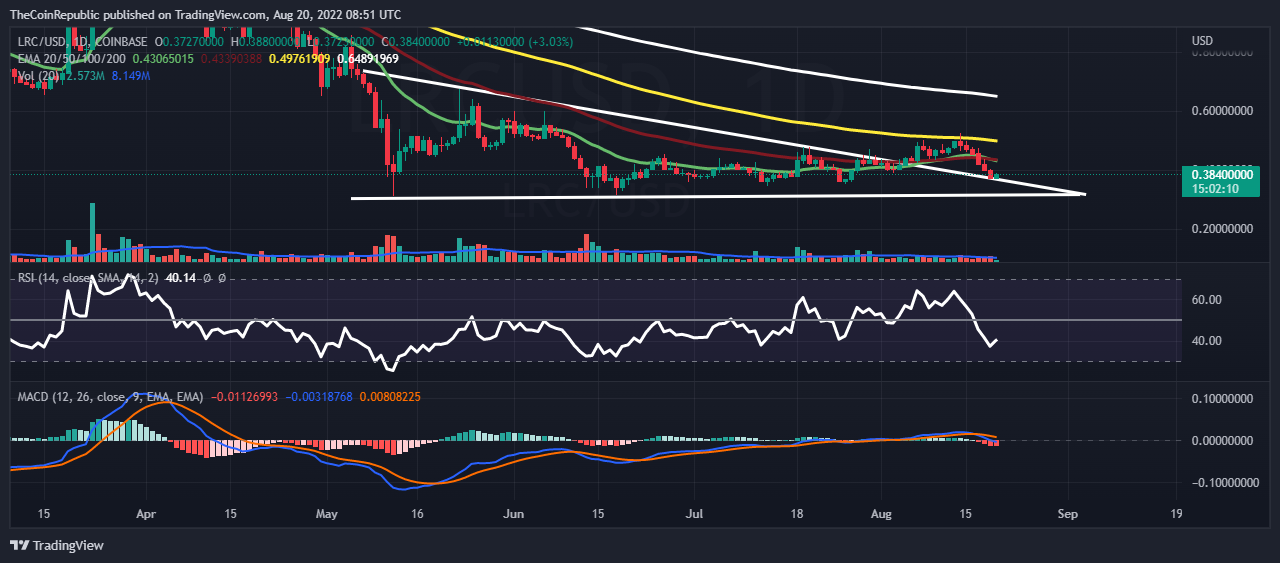
While talking about the technical indicators over the daily price chart we can observe the LRC token moving below the negative cross over the daily price chart.
But the token has started recovering as we can observe over the relative strength index as it took a U-turn amid the increase in buyings. The RSI value is nearly equal to 40. But the LRC token needs some more support to reflect the recovery over the MACD indicator, it still displays the sellers’ domination as the buyers’ line is moving below the seller’s signal line over the daily price chart. The trading volume needs to be healed as in turn it will pump the price.
Conclusion
After registering a breakout from the descending triangle the price was falling again amid the bearish dominance over the daily price chart. The LRC bulls should make some constant efforts over the token to make the recovery sustainable or else the bears will make the ecosystem collapse. While the technical indicators indicate initiation of uptrend movement. The investors can make an entry now as it appears a good opportunity to the analysts.
Technical levels
Resistance levels: $0.44 and $0.52
Support levels: $0.35 and $0.31
Disclaimer
The views and opinions stated by the author, or any people named in this article, are for informational ideas only, and they do not establish the financial, investment, or other advice. Investing in or trading crypto assets comes with a risk of financial loss.