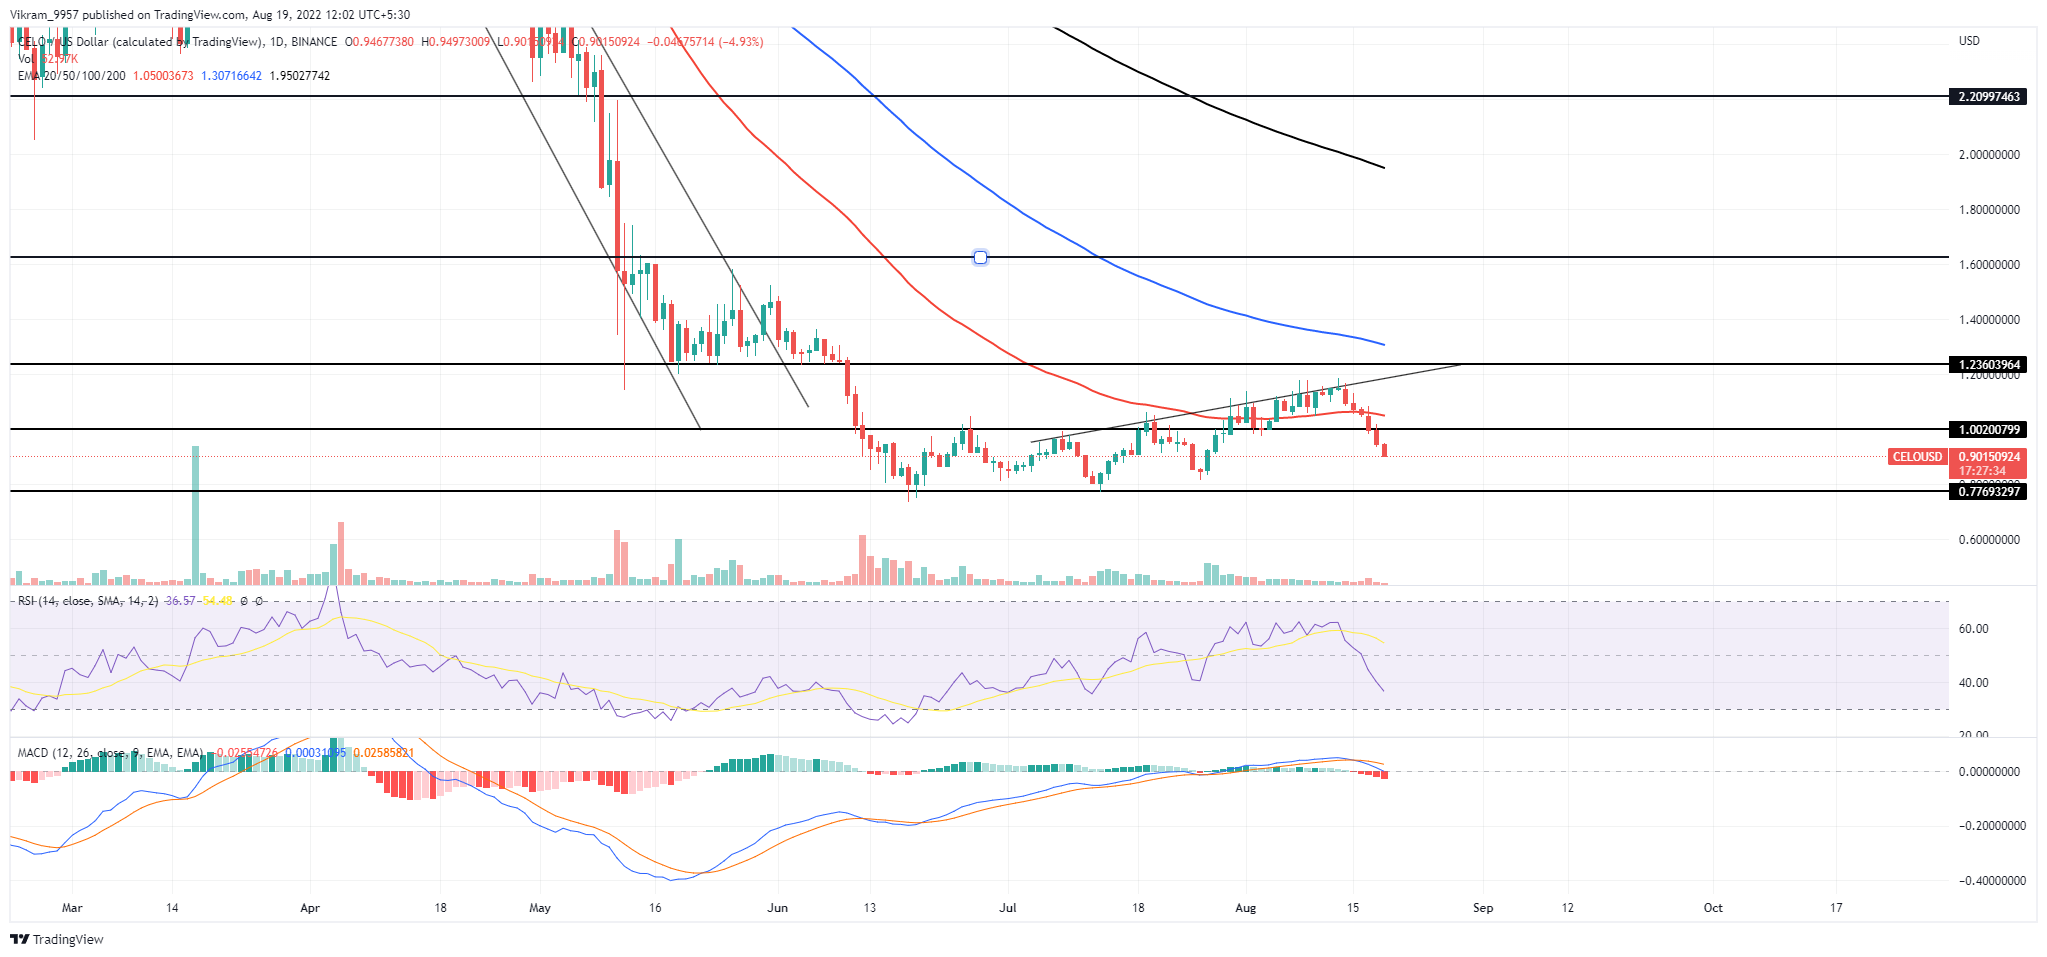
The CELO price action shows a decisive breakdown from the broadening wedge pattern, indicating a revisit to $0.742. So, should you turn bearish?
Key Technical Points:
- The ascending broadening wedge pattern is a reversal pattern that triggers a significant downfall.
- The MACD indicator slopes on the verge of dropping below the midline will give additional confirmation for selling.
- With a market cap of $396 million, the intraday trading volume of CELO has increased by 17.40% to reach $21.98 million.
Past Performance of CELO
Amid the recent recovery sentiment in the crypto market, the CELO/USDT pair formed a broadening channel pattern in the daily time frame chart. Under this pattern's influence, the coin price recovered 63.4% from the $0.734 low, hitting the $1.12 support zone. However, the multiple long-wick rejection candles indicate the bullish momentum was exhausted.  Source - Tradingview
CELO Technical Analysis
On August 14th, the CELO price reverted from the combined resistance of the pattern's trendline and the $1.197 barrier. The resulting downfall showed six consecutive red candles, registering a 27.28% loss. Furthermore, the coin price currently trades at $0.862 and triggers a breakdown from the channel pattern. A bearish crossover between the 20-and-50-day EMA bolsters the continuation of the prevailing downtrend. The daily RSI slope nosedive below the neutral zone, indicating the market sentiment has shifted on the bears' side. However, the MACD indicator displays a significant spread between the bearish alignment of the fast and slow line, indicating aggressive selling in the market. In a nutshell, the CELO technical analysis displays the technical indicators and the price action in harmony, maintaining a bearish outlook.
Upcoming Trend
A daily candlestick closing below the support trendline will indicate the completion of a broadening channel pattern. This pattern breakdown will accelerate the selling pressure and may plunge the coin price 15% down to $0.742. On a contrary note, if buyers manage to push above the rising trendline before the day's end, the possible reversal may trigger another bull cycle within this pattern. Resistance Levels: $1 and $1.12 Support Levels: $0.8 and $0.742
 cryptoknowmics.com