The latest Aave price analysis shows a very solid downtrend, as the price underwent a substantial decline in the last 24 hours. If we analyze the market situation from a general perspective, then the past few weeks have proved to be highly profitable for the buyers as the price was regularly increasing. On the other hand, a constant downtrend has been on the rise since 17 August 2022, and a similar trend is observed even today, as the price came down on a massive scale. The crashing price action has devalued AAVE/USD down to an $85.7 low.
AAVE/USD 1-day price chart: Aave at a loss of 13.47 percent
The one-day Aave price analysis confirms a strong bearish trend for cryptocurrency, as the AAVE/USD value is going through a sharp decline. A considerable amount of downfall in cryptocurrency value is being detected due to rising selling pressure in the market. If the selling pressure persists, it can be predicted that the price will lower further today. The cryptocurrency is trading hands at $85.7, which is a relatively lower level if we compare it to its moving average (MA) value of $104.2. The coin has lost a 13.47 percent value during the last 24 hours, but the trading volume has increased by 10.15 percent.
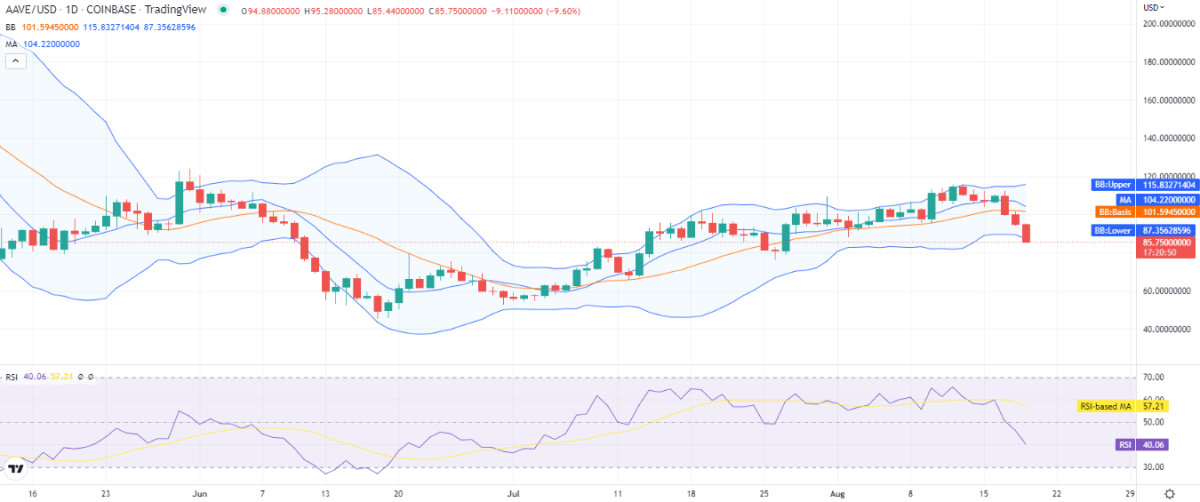
The volatility is expanding because of the continuous extension of the downward trend. The upper end of Bollinger Bands Indicator is now at the $115.8 mark indicating the resistance for Aave, whereas its lower band is present at the $87.3 mark, which was previously representing the support that has now fallen as the price crashed below the lower band. The Relative Strength Index (RSI) score has decreased to index 40 and will decrease further during the day as the selling activity is on the rise and the indicator’s curve is steeply downwards.
Aave price analysis: Recent developments and further technical indications
The four-hour Aave price analysis dictates a downtrend as the bears have been maintaining their lead quite furiously. The bulls seem to be helpless in the current situation as the price levels are falling at a sharp angle. The downtrend has resulted in price devaluation up to the $86.4 mark, encouraging the sellers. If we discuss the moving average indicator, then its value is currently $96.9.
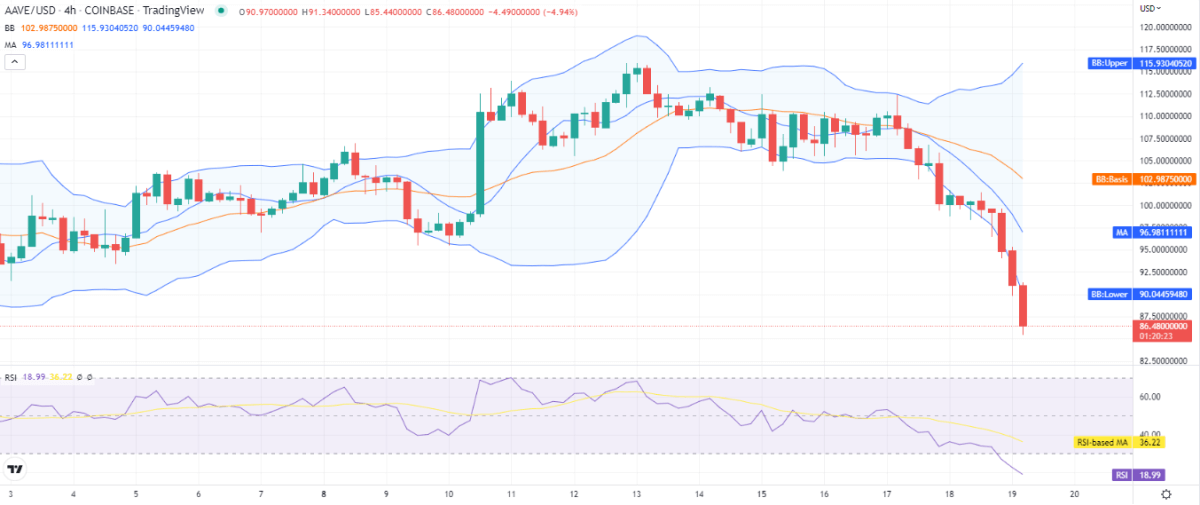
The Bollinger bands average has moved down to $102.9 because of the constant decreasing trend. The upper band of Bollinger Bands Indicator is now touching the $115.9 mark, and the lower band is touching the $90 mark, where the price has gone below the lower band on the 4-hour chart as well. The RSI curve is moving descendingly as the score is now 18, which is quite low as the indicator shows underbought conditions for Aave.
Aave price analysis conclusion
The one-day and four hours Aave price analysis are giving support for the bears, as a consistent drop in AAVE/USD value is being observed. The price lowered to $86.4 in the last four hours, as the bears are leading the charts today. The hourly price chart displays long red candlesticks as well, which means that the bears have been ruling the market for the last four hours. We expect the crypto pair to continue following bearish momentum for today.
Disclaimer. The information provided is not trading advice. Cryptopolitan.com holds no liability for any investments made based on the information provided on this page. We strongly recommend independent research and/or consultation with a qualified professional before making any investment decisions.