Monero (XMR) is an open-source, privacy-oriented cryptocurrency with a blockchain intentionally configured to be opaque. It makes transaction details, like the identity of senders and recipients, and the amount of every transaction, anonymous by disguising the addresses used by participants. Along with anonymity, the mining process for Monero is based on an egalitarian concept. This is the principle that all people are equal and deserve equal opportunities. Its developers did not keep any stake for themselves when they launched Monero but they did bank on contributions and community support to further develop the virtual currency.
Let us look at the technical analysis of XMR.
Past Performance
On July 06, 2021, XMR started trading at $216.23. As of July 13, 2021, the closing price of XMR was $197.35. Thus, in the past week, the price has plummeted by roughly 10%. In the last 24 hours, XMR has traded between $195.94 – $200.43.
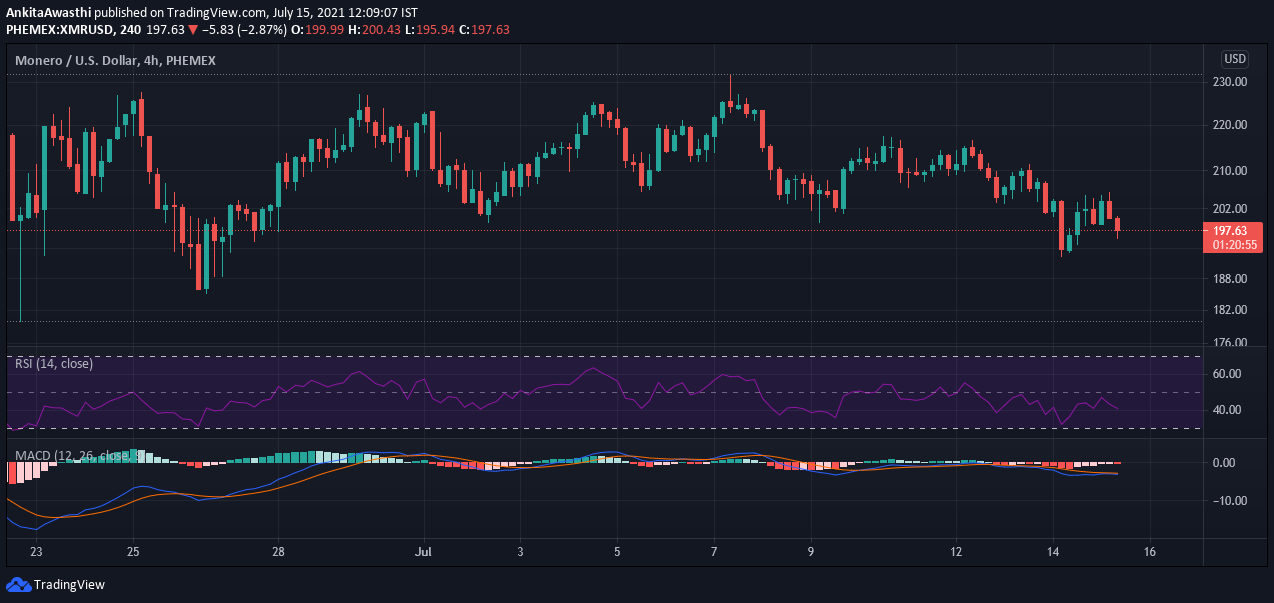
https://www.tradingview.com/x/96zfxXp2/
Day-Ahead and Tomorrow
Currently, XMR is trading at $197.65. The price is down by approximately 2% from the opening price of $200.65. Thus, the market looks bearish. Also, XMR is forming a very crucial narrow range on the daily chart. A breakout from this level will confirm the trend for XMR. A breakout from this level will lead to making new highs. But, a breakdown will confirm the bear trend and the price can test the crucial support level at $189.26.
On the daily chart, the MACD and signal lines are in the negative zone just below the zero line. Moreover, a bearish crossover by the signal line over the MACD line can be seen. Therefore, the overall market momentum seems bearish, and we can expect the XMR price to fall for the rest of the day. Also, if the price sustains above the support level for a day or two. Then, chances for an upside movement are high.
The RSI indicator is at 39.9%. It is forming a bearish divergence. Thus, indicating that the selling pressures are slowly mounting. Hence, we can expect the price to fall.
XMR Price Analysis
Currently, the price is trading below the 23.5% Fibonacci pivot point of $201.16. As some of the oscillators have shown bearish signals, we can expect the price to fall below the second Fibonacci pivot support level of $193.54 soon.
The price has tested the FIB resistance level of $206.34 a few hours ago. If the price rises from this FIB extension level in some time, this implies that the price uptrend is strong. In that case, the price is likely to rise.