OKB is a blockchain-based cryptocurrency that operates on the Ethereum platform. It is a global utility token that is issued by the OK Blockchain Foundation. The community provides various services where the OKB can be used. The services include Security, Financial, and Utility services. Let us look at the technical analysis for OKB.
Past Performance
OKB started trading at $10.00 on July 09, 2021. On July 14, 2021, OKB ended the day at $11.21. Amid volatility in the market, OKB gained 12.1% in the previous week. In the last 24 hours, OKB traded between $10.29-$11.56.
https://www.tradingview.com/x/60qEmVSv
Day Ahead And Tomorrow
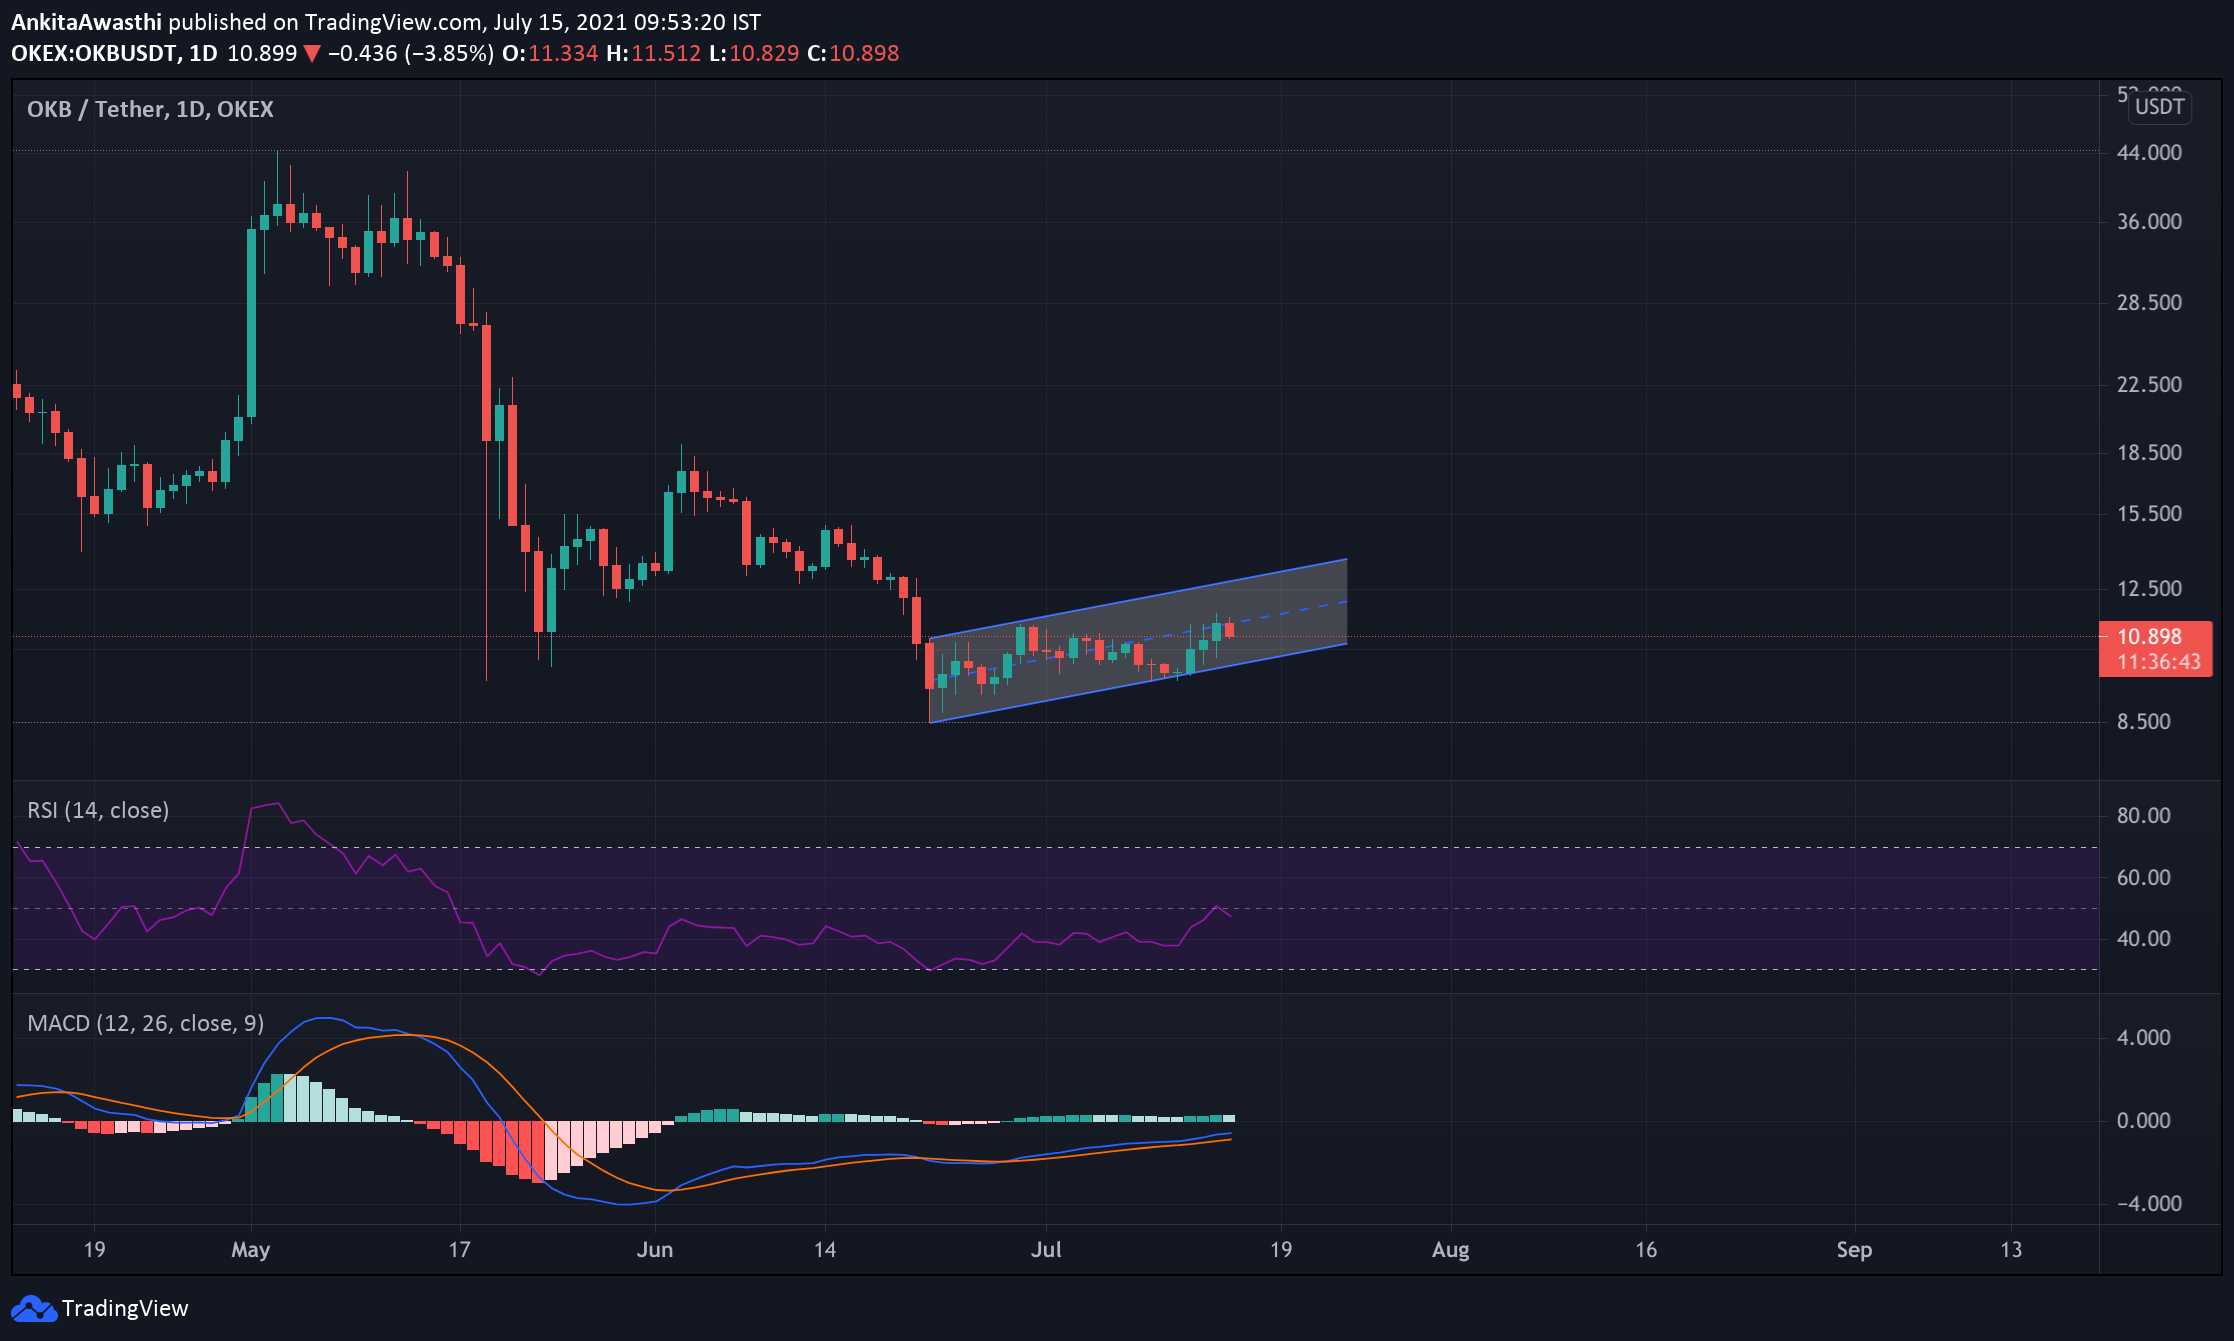
Currently, OKB is trading at $10.96. The price is down by 3% (approximately) from the opening price of $11.56. Thus, making a bearish candlestick. OKB has currently tested a month-long resistance level at $11.60, and fallen from that level. If the buying pressure gains momentum again in the market, then, we can expect a breakout from this resistance level and make new monthly highs.
Now, the MACD and signal lines are in the negative zone, that is, below the zero range. However, forming a bullish crossover by the signal line over the MACD line. Thus, indicating the overall market momentum is bullish, and we can expect a surge in price after some retest.
The RSI indicator has resisted from the equilibrium, therefore indicating a short pull back on a daily level. The RSI indicator is at 47%. It has fallen after resisting from the mark of 50%. Thus, indicating that some profit booking is increasing in the market. While looking at the long-term trend, it is making a bullish divergence. Therefore, RSI can break out of its month-long resistance and make a new support level above the equilibrium.
OKB Technical Analysis
Currently, the price is trading above the Fibonacci pivot point of $10.88. By making the new support level, the price can rally from this level and form new highs. Also, as some of the oscillators have shown bullish signals, we can expect the price to increase and test the Fibonacci pivot resistance level of $11.62 soon. If the price breaks this FIB resistance level, it will highlight the next resistance at $12.87.
However, if the seller’s domination continues in the market, we will have to closely watch the level of $10.43 as an immediate support level. If the price breaks this level, it can test the level of $10.06. Thus, traders can take a short position between these levels.