SIA is a blockchain-based decentralized cloud storage platform. The business deals and agreements are enforced with smart contracts. The fees of using the platform are paid by the token called SC. SIA is in direct competition with major cloud storage providers such as Google, Amazon, and Microsoft. Let us look at the SC technical analysis.
Past Performance
On July 09, 2021, SC opened at $0.0134. On July 14, 2021, SC closed at $0.0117. Thus, in the past week, the SC price has decreased approximately by 10%. In the last 24 hours, SC has traded between $0.0111 – $0.0121.
https://www.tradingview.com/x/h4Himlql/
Day-Ahead and Tomorrow
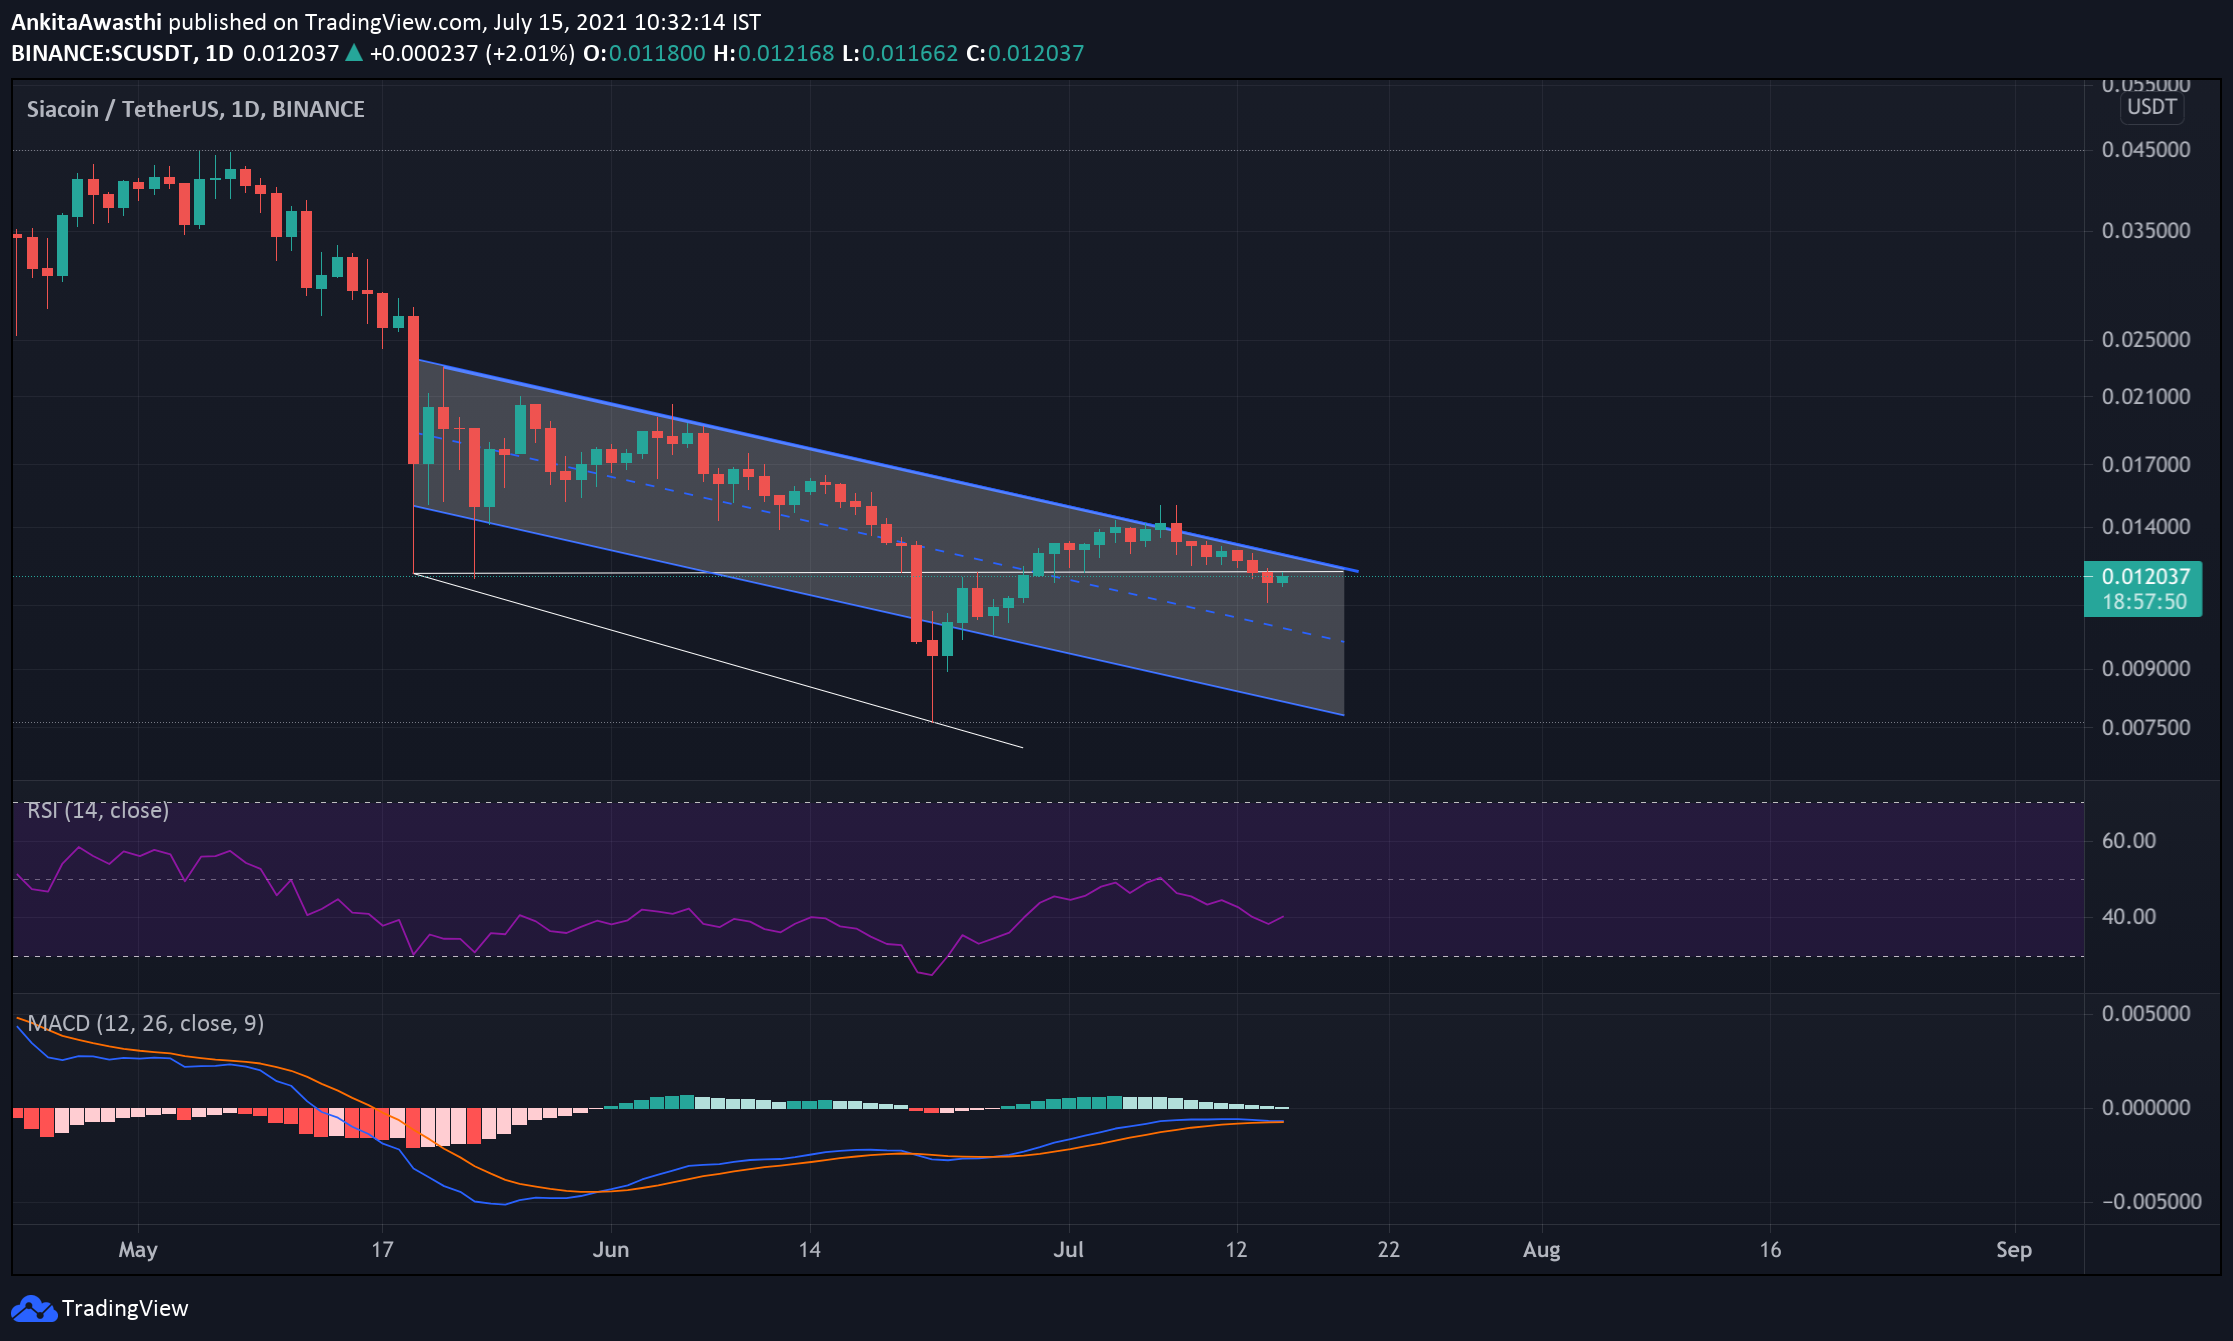
At the time of writing, SC is trading at $0.0119. The price is up by 5.23% (approximately) from the opening price of $0.0118. Thus, indicating high buying pressure in the market, and forming a bullish candle for the day. However, SC is forming a narrow range on the daily chart, a breakout on either side will give us a better outlook. We have to closely watch the demand zone (current level) and see if the price tests and breaks the long-term support level or not. If the SC price breaks and sustains below the support level of $0.0121, a bear trend will be confirmed.
On the daily chart, the MACD and signal lines are below the zero range. Moreover, we can see a bearish crossover by the MACD line over the Signal line. Thus, the overall market momentum seems bearish, and we can expect a price to fall for a day or so.
The RSI on the daily chart is below the equilibrium. It is taking support at the 38.09% mark. It has fallen from the 50% mark. Which has acted as strong resistance in the past. Thus, it indicates that the selling pressure is mounting up in the market, and is taking over the buying pressure. Hence, for the rest of the day, we can expect the price to fall.
SC Technical Analysis
SC is trading below the Fibonacci pivot support level of $0.012. Which has acted as a strong support level. We can expect the price to hold at this pivot level, however, if the buying pressure remains the same, the price might breakout from the level to rise. Here, an opportunity for a long position arises.
Traders can enter into the long trade, once the price breaks $0.012, by keeping the target of $0.013 and stop-loss at $0.011.