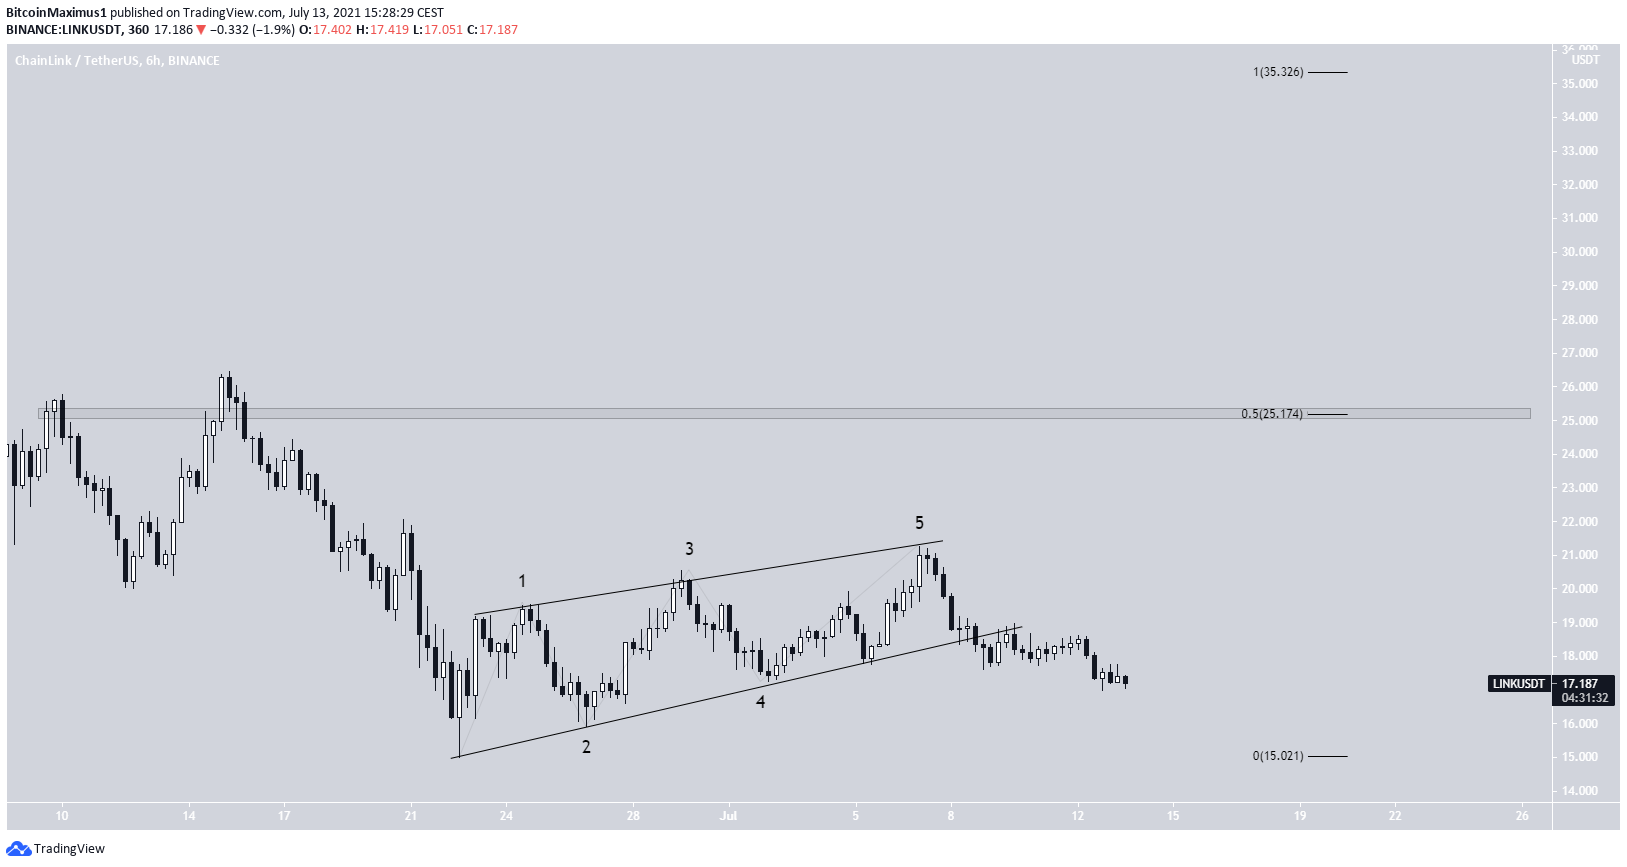
Chainlink (LINK) has bounced at the $17.30 support area and potentially completed a leading diagonal pattern.
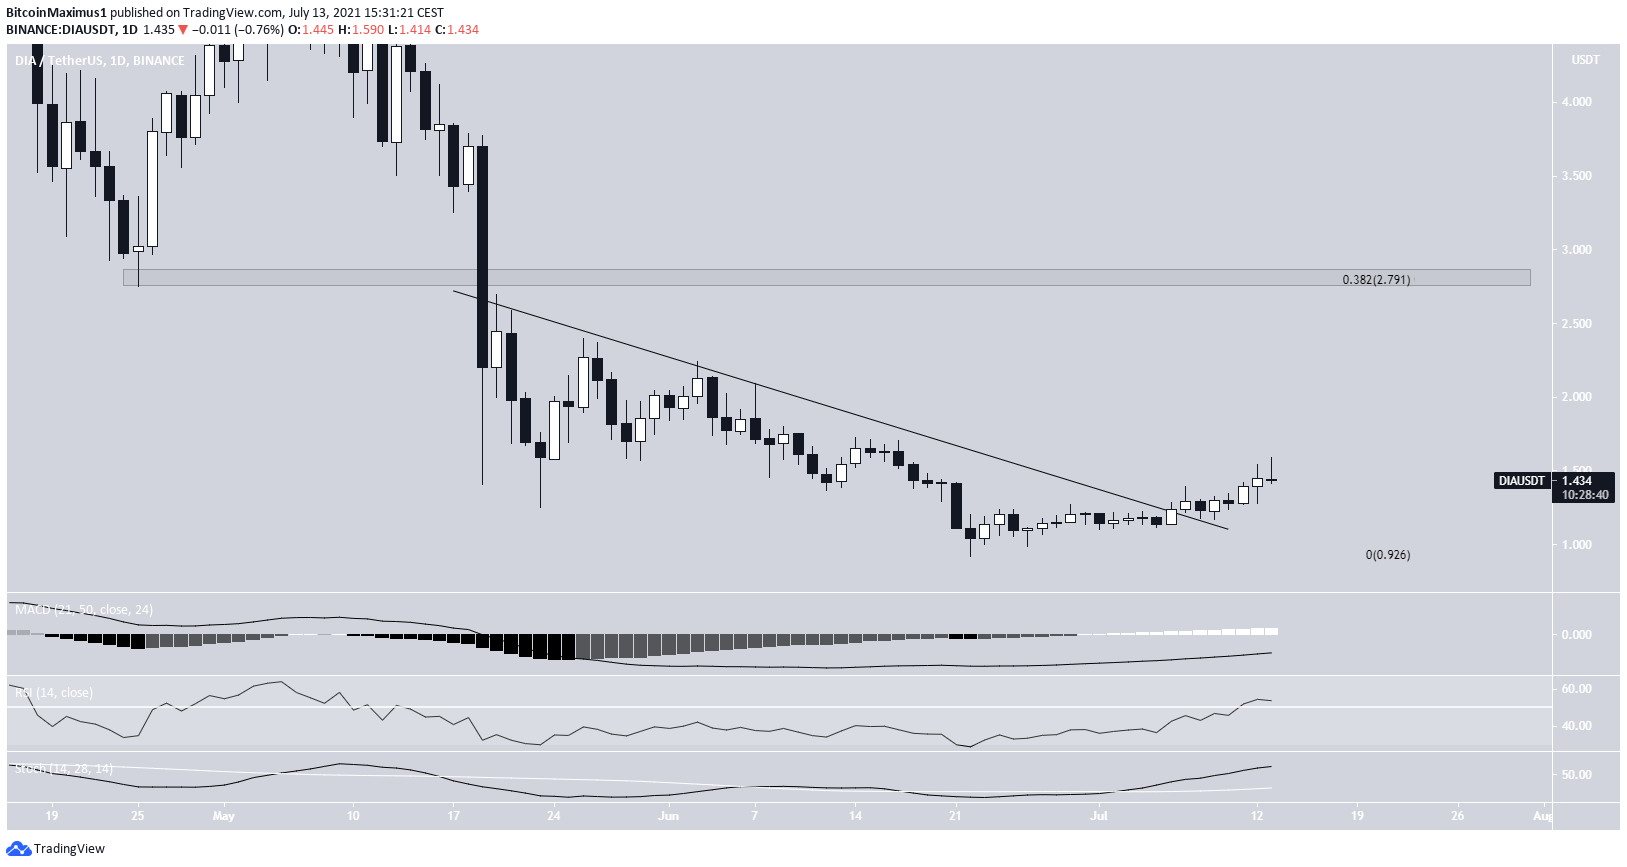
DIA (DIA) has broken out from a descending resistance line.
Band Protocol (BAND) has bounced at the $5.50 horizontal support area and broke out from a descending resistance line afterwards.
LINK
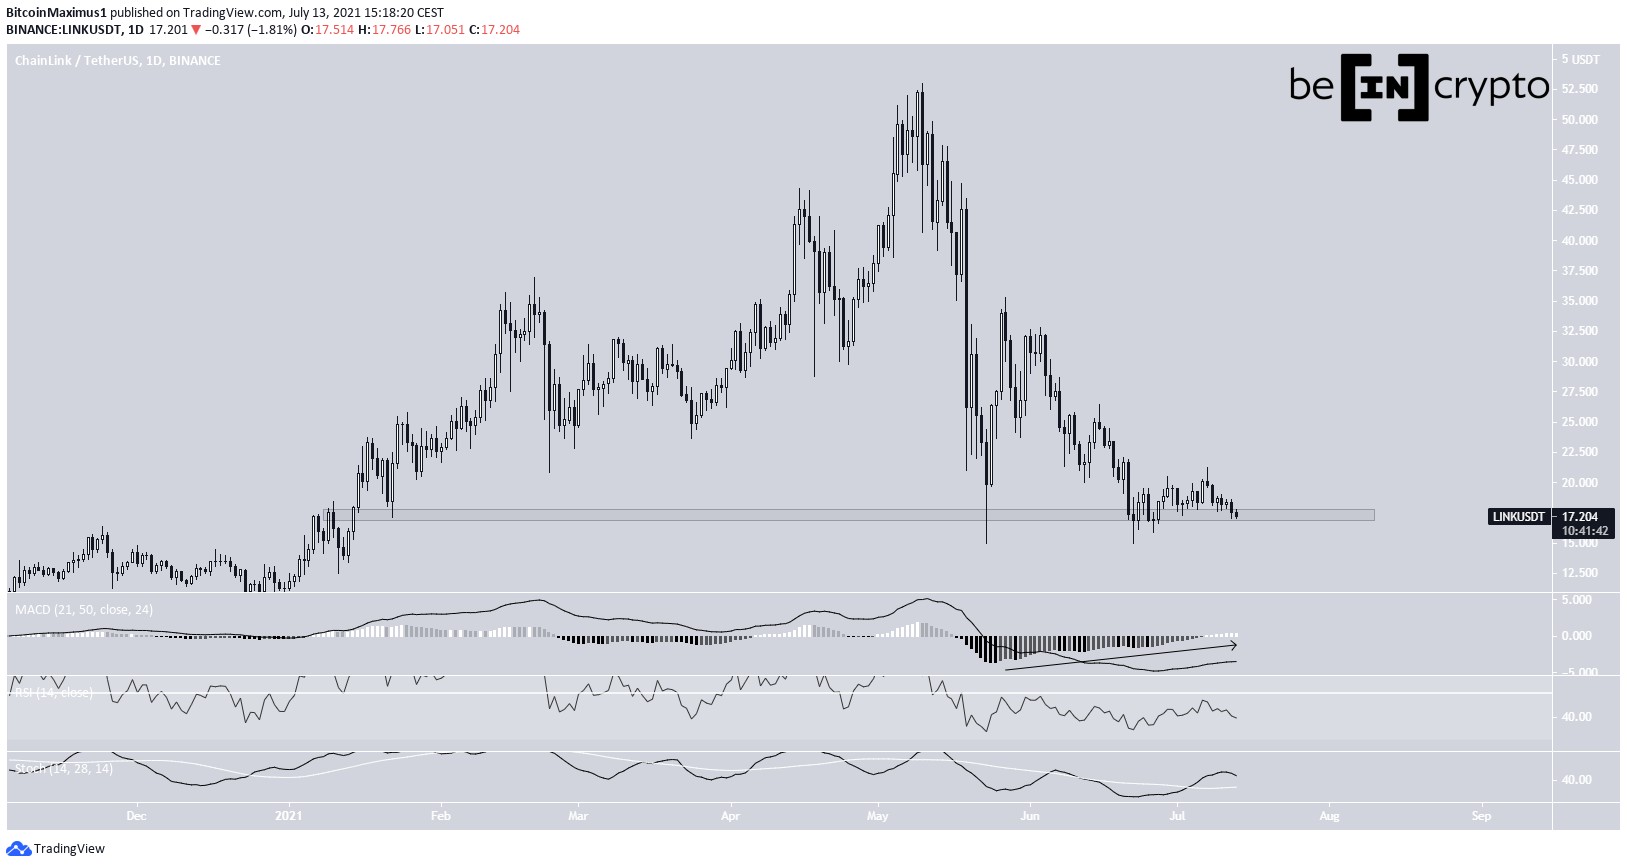
LINK has been moving downwards since May 10, when it reached an all-time high price of $53. The downward movement culminated with a low of $15, reached on May 23. The ensuing bounce left a long lower wick in place and served to validate the $17.30 area as support.
While LINK bounced initially, it returned to this support area on June 22.
Despite the lack of an upward movement, technical indicators are relatively bullish. While the RSI is still below 50, the Stochastic oscillator has made a bullish cross, and is moving upwards alongside the MACD.
The movement since the June 22 lows looks like a leading diagonal. After the high of $21.27 was reached, the token broke down, completing the pattern.
It is currently trying to find support, after which another upward movement would be expected. The closest resistance area is at $25.17, the 0.5 Fib retracement resistance level.
Highlights
- LINK has bounced at the $17.30 support area.
- It has completed a leading diagonal.
DIA
DIA has been moving upwards since June 22, when it reached a low of $0.921. The upward movement caused a breakout from a descending resistance line on July 6. This led to a high of $1.57 seven days later.
Technical indicators support the continuation of the upward movement. The Stochastic oscillator, the RSI & MACD are all moving upwards. The Stochastic oscillator has made a bullish cross while the RSI is above 50.
The closest resistance is at $2.79. This is the 0.382 Fib retracement resistance level and a horizontal resistance area.
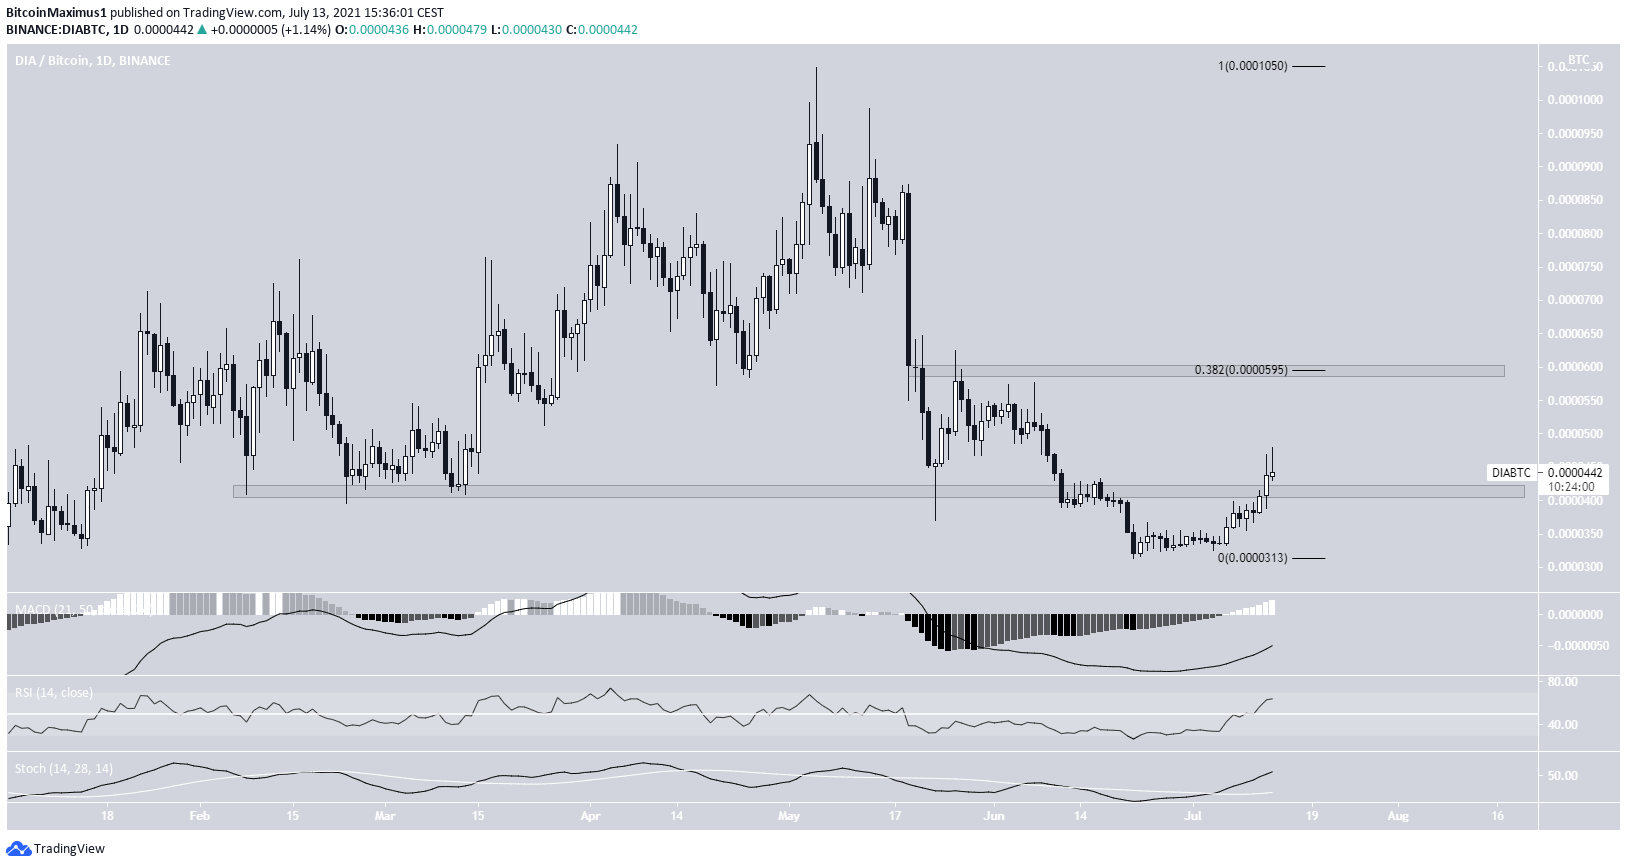
The DIA/BTC pair has also been moving upwards since June 22. It has reclaimed the 4150 satoshi area, a crucial support level that had held for several months.
Similarly to the USD pair, technical indicators are bullish, supporting the continuation of the upward movement.
The closest resistance is at 5950 satoshis.
Highlights
- DIA has broken out from a descending resistance line.
- There is resistance at $2.79.
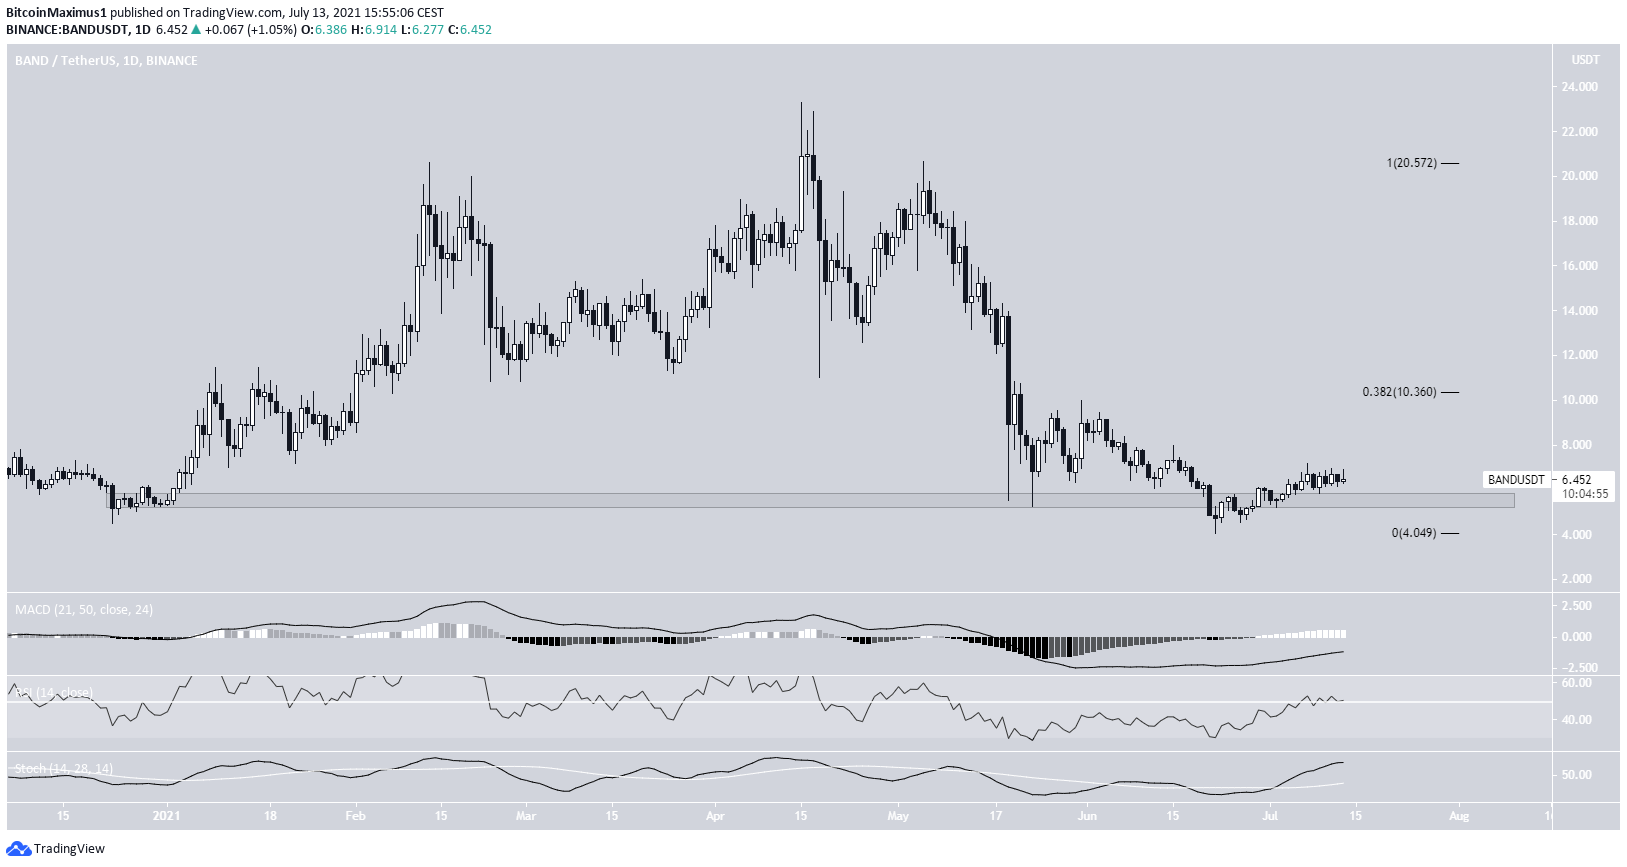
BAND
BAND has been decreasing since April 15, when it reached an all-time high price of $23.30. The downward movement continued until a low of $4.06 was reached on June 22.
While this initially seemed like a breakdown below the $5.40 area, the token reclaimed the area shortly afterwards, rendering the previous decrease as a deviation only.
Technical indicators are bullish, supporting the continuation of the upward movement. This is especially evident by the RSI cross above 50.
The closest resistance is at $10.36.
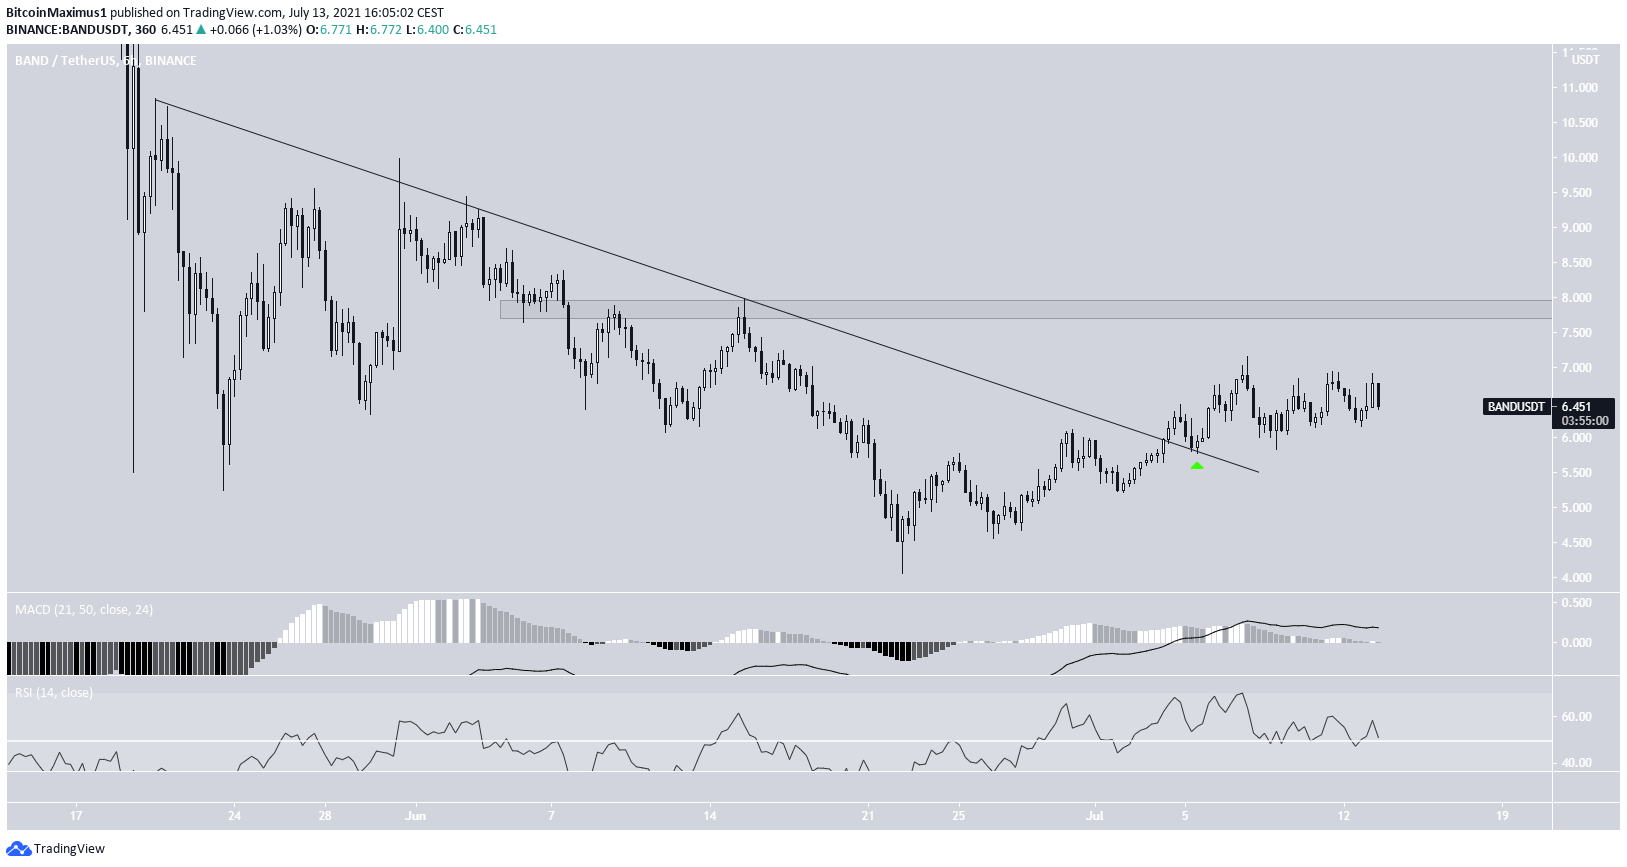
The shorter-term six-hour chart shows a breakout from a descending resistance line and its validation as support afterwards (green icon).
The MACD & RSI are also relatively bullish despite the lack of strength. The former is above 50 while the latter is above 0.
The closest horizontal resistance area is at $7.80.
Highlights
- BAND has bounced at the $5.40 horizontal support area.
- It has broken out from a descending resistance line.
For BeInCrypto’s latest bitcoin (BTC) analysis, click here.