The recent behavior of the cryptocurrency market can be compared to that of a rollercoaster, with the prices moving up and down sporadically. The market shift has also affected major coins like Bitcoin [BTC], Ethereum [ETH] and Tron [TRX], which have seen a mix of both uptrends and downtrends. Tron, which has been in the news multiple times recently, owes its success to the rapid developments and updates.
1-hour:
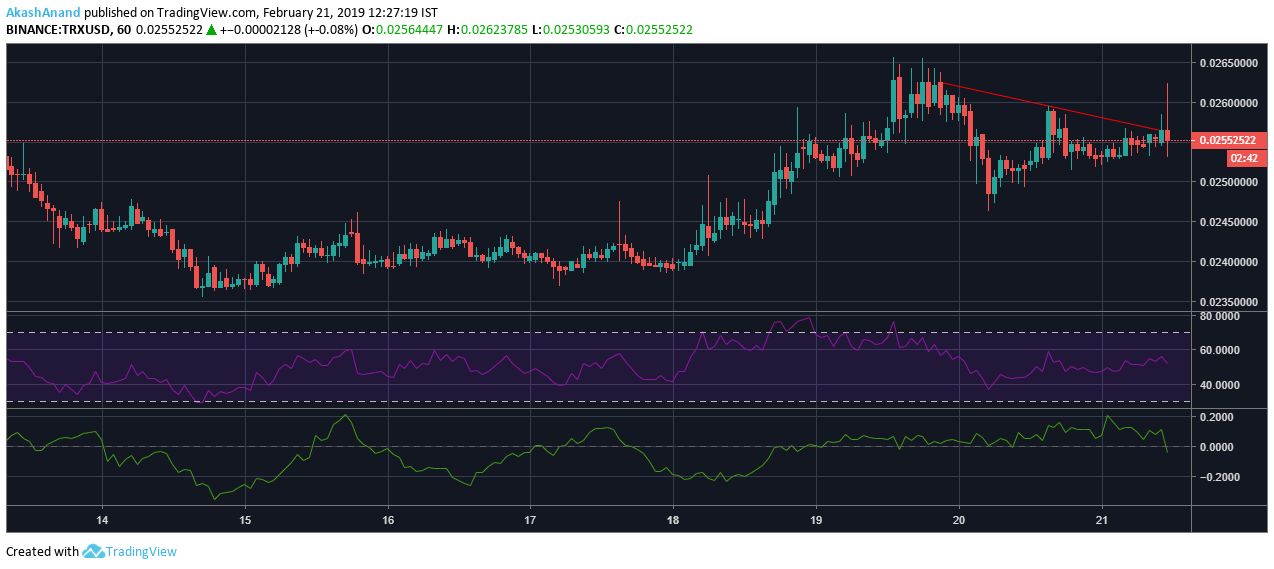
The one-hour graph of Tron shows a cryptocurrency in the throes of the bear, but trying to escape it. The support has been holding at $0.0236, while the resistance is at $0.0263. The visible downtrend resulted in the price dropping from $0.0262 to $0.0255.
The Relative Strength Index is in the middle of the graph, which is a sign of the selling pressure being equal to the buying pressure.
The Chaikin Money Flow has been holding above the zero-line, after which it has slightly dipped below it. The fall below the line shows that the capital leaving the market is more than the capital coming into the market.
1-day:
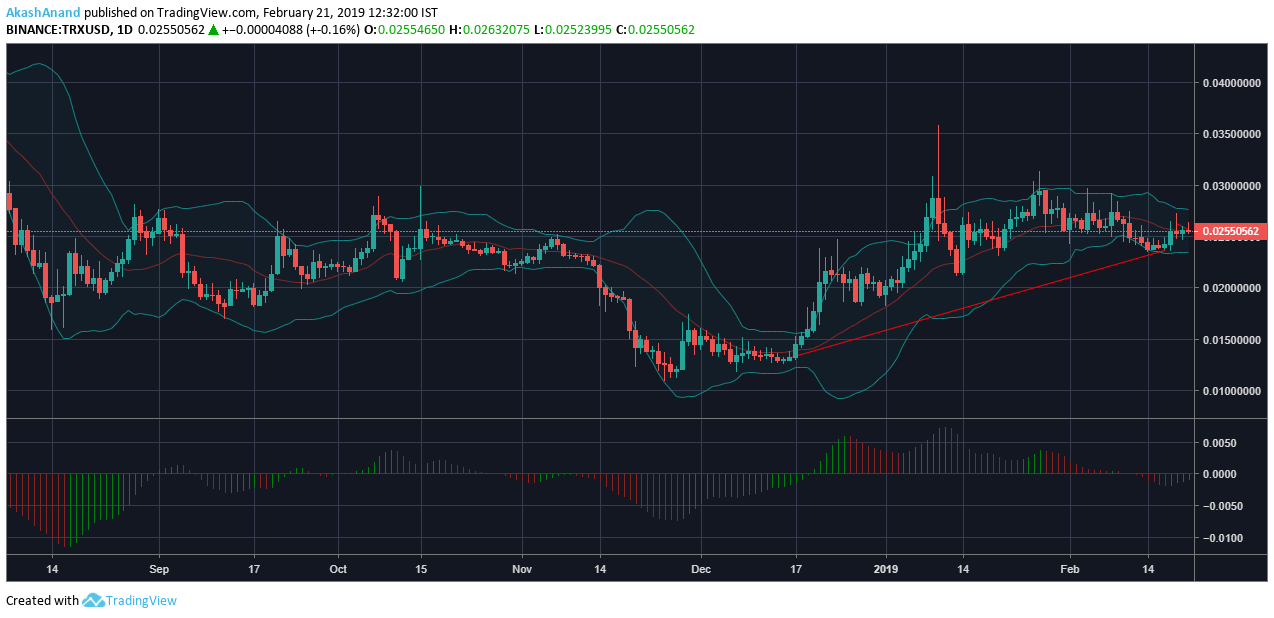
The one-day graph paints a different picture as Tron is one of the better performers in the market. The long-term support is at $0.0117 while the uptrend lifted the price from $0.0133 to $0.023.
The Bollinger bands show the market volatility slowing down as the upper band and the lower band have both started moving in a parallel fashion. The lack of major price outbreaks is also evidenced by the small size of the Bollinger cloud.
The Awesome Oscillator has dropped in amplitude as the market momentum has decreased since the beginning of 2019.
Conclusion:
The above-mentioned indicators all point to Tron continuing its sideways movement behavior after the last bull run lifted its immediate support. At the moment, the market does not show signs of any major trend changes or outbreaks.