Litecoin [LTC] is enjoying a decent bullish run over the past few days and is recovering from the early January slumps that hit the cryptocurrency market. That said, it has seen a negative growth rate of 1.63% over the past 24 hours. It is presently valued at $33.63.
At the time of press, Litecoin [LTC] had replaced Tether on the list of the world’s largest cryptocurrencies in the sixth position and has a market cap of $2.03 billion. LTC also had a 24-hour trading volume of $773 million, with the exchange Coineal contributing a significant 7.63% of the trade via the trading pair LTC/BTC.
1-hour
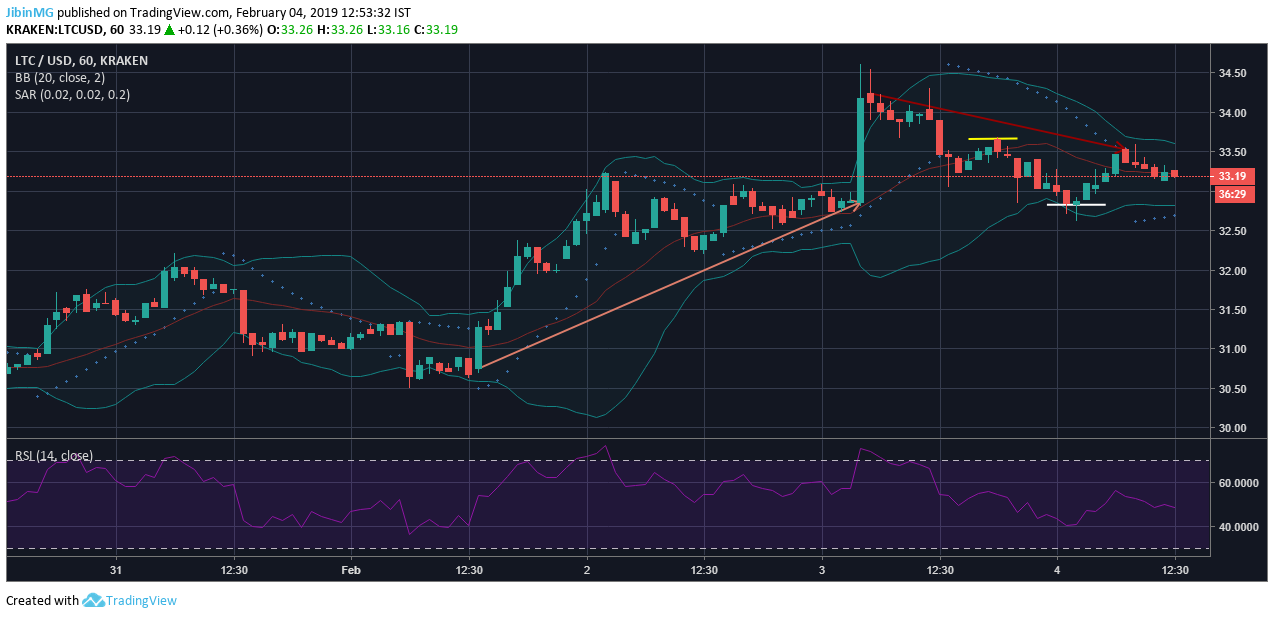
Source: TradingView
The one-hour chart for the LTC market suggests that a brief downtrend extending from $34.24 to $33.53 has cut into the gains the LTC market enjoyed over the weekend. These gains were reflected by the uptrend that extended from $30.75 to $32.86. Both the support points at $32.83 and resistance point at $33.67 are holding for the time being. However, they may soon be breached over the ensuing trade cycles.
The Parabolic SAR has its markers below the candlesticks. This suggests that despite the downtrend, some bullish activity is pushing the price of the LTC market upwards.
The Bollinger Bands are presently neither expanding or contracting. This suggests that volatility is in control and that any price movement over the new few cycles will be within the $32.75 and $33.75 range.
The Relative Strength Index suggests that both the buying and selling pressures have evened themselves out in the LTC market.
1-day

Source: TradingView
The one-day chart suggests that the LTC market is still recovering from the massive downtrend that extended from $52.07 to $28.59. There has been some bullish resistance, however, pushing the uptrend from $23.38 to $30.67, and maybe even beyond. The support point holds firm at $22.72 while sustained bullish momentum may endanger the resistance point at $39.15.
The Chaikin Money Flow chart suggests the coin is recovering from its slumps and that money is flowing back into the LTC market.
The Awesome Oscillator suggests that although neither the bears nor the bulls have any sustained momentum in the LTC market, the bulls seem to have the upper hand.
The MACD index indicates that the MACD line is creeping above the signal line. This is backed by the histogram which suggests that the bulls are pushing the LTC market upwards.
Conclusion
Each of these charts suggests joy for the LTC market. While the one-hour chart using indicators such as the Parabolic SAR and RSI have suggested a significant advantage to the bulls, the longer-term, one-day chart suggests that although Litecoin is still a long way from overhauling the previous downtrend, the bulls have the momentum.