A bullish technical indicator has flashed on the 4-hour chart for ApeCoin. This could suggest that the price of ApeCoin will spike higher. Interested investors could take advantage of this opportunity for a quick scalping profit as APE gears up to retest the immediate resistance barrier.
On May 9, the price of ApeCoin (APE) dipped below $9.64, which was a long-standing support level for the coin. The dip was then followed by an attempt to overcome the aforementioned level. Unfortunately, the attempt failed and resulted in a 50% crash.
The price of APE, then, dropped to around $5.11 – a price that is only slightly above its listing price of $5.02. However, the price of APE set two lower lows on May 11 and May 12.
There now seems to be a sign of a short spike in the price of APE as the two lower lows were accompanied by a Relative Strength Index (RSI) that formed higher lows. This signals a bullish divergence.
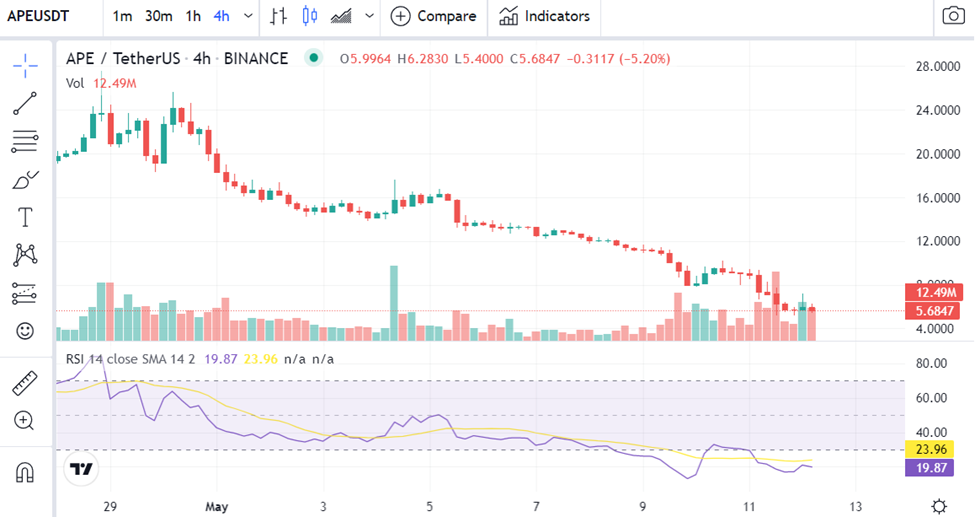
The formation of a bullish divergence indicates that the bullish momentum is picking up while the price is declining, which is a scenario that more often than not is preceded by a spike in the value of the underlying asset. At the time of writing, this spike is already underway.
As things stand, the price of APE has already rallied around 23% from its May 11th low of $5.11. Investors can expect APE’s price to rise another 25%, given the formation of the bullish divergence. This 25% rise will see the price of APE reach $7.89.